Election Analytics
Incumbency
10/4/2020
There are often perceived benefits for incumbents in US Presidential elections. As a sitting president with the ability to run in the following election, a candidate has the ability to make decisions that affect where federal money is spent. We might expect, therefore, that Presidents that intend to run for reelection will be strategic in their efforts to direct government funding to curry favor with voters in key states. We might also expect that this sort of strategy could apply even when the candidate is not running again because they would still like their party to win the following election.
In light of this, in this blog post I consider how federal spending could be used to predict the result of the election. In particular, I will compare the change in federal grants spent in a given state and the change in two-party popular vote share earned by the incumbent party between consecutive election cycles in that state.
I consider how this trend differs when the incumbent party is the Democratic Party versus the Republican Party and how the trend differs for states considered swing states as opposed to safe states. (Note that a swing state is a state that is thought to be competitive between the two major parties and a safe state is any non-swing state. The swing states may change between different election cycles.)
Plotting the Trends
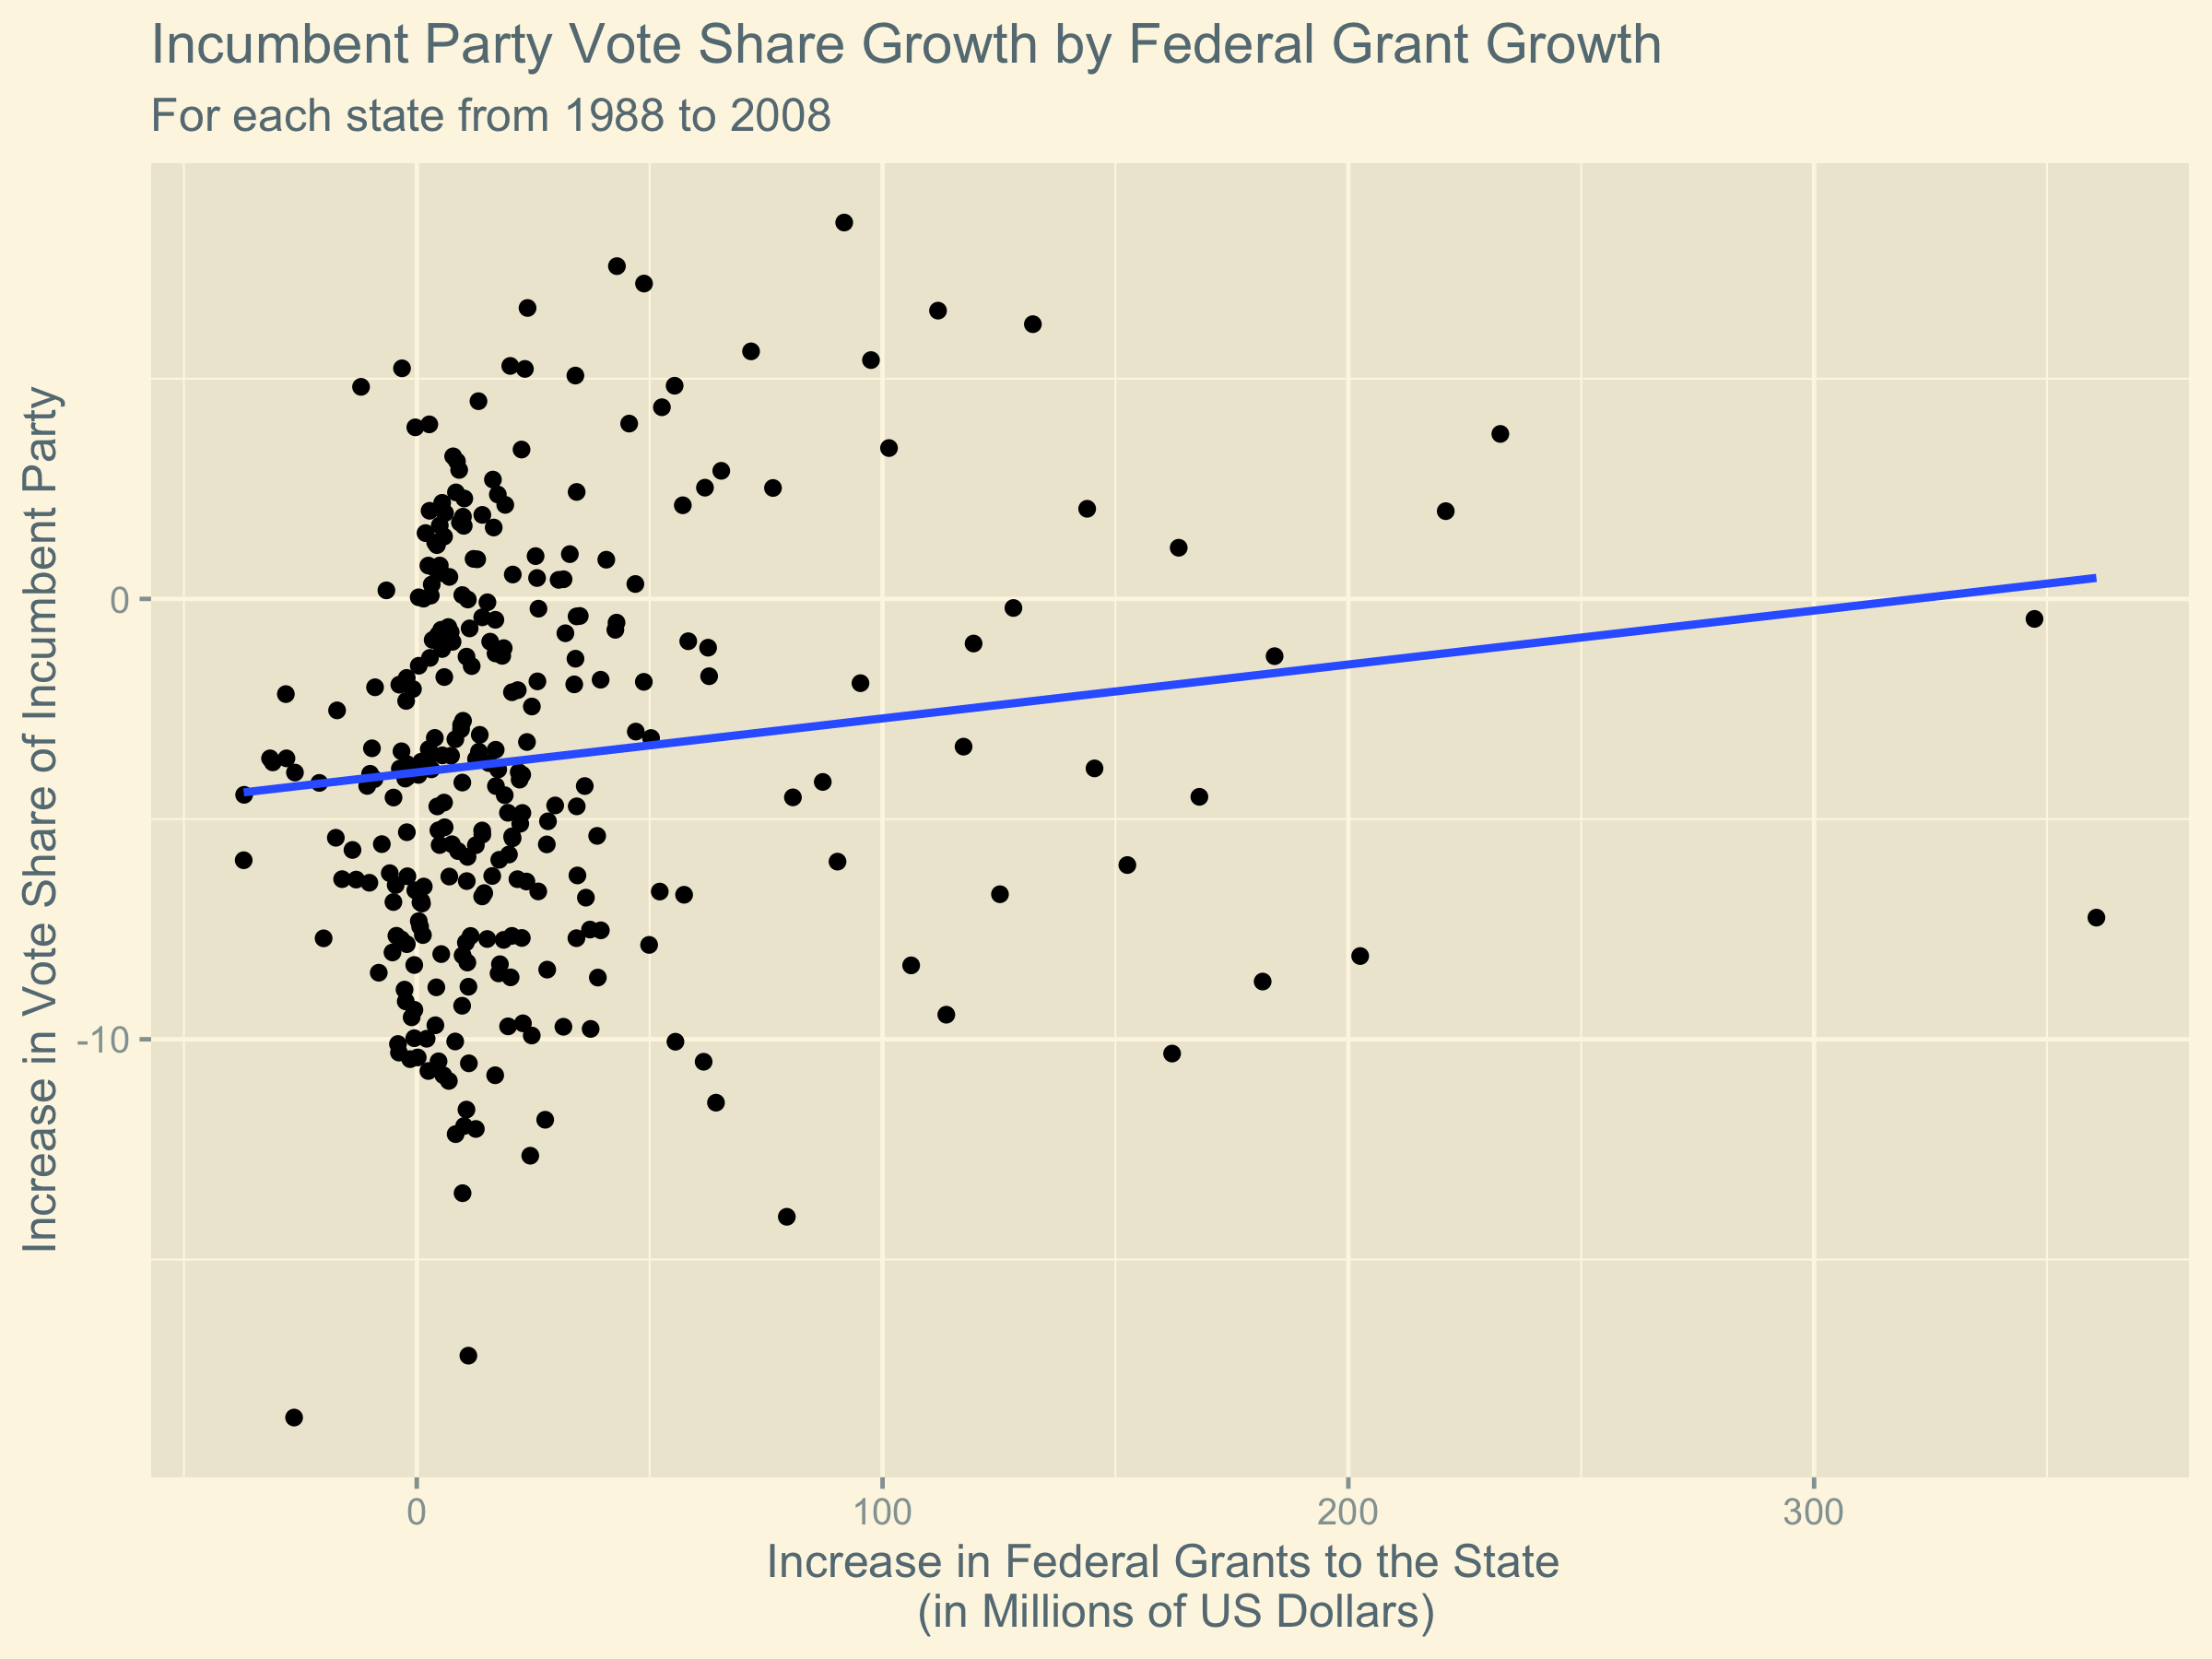
First, we consider the overall trend comparing the change in the federal grants spent in a state and the change in the two-party vote share acquired by the incumbent party as compared to the previous election cycle.
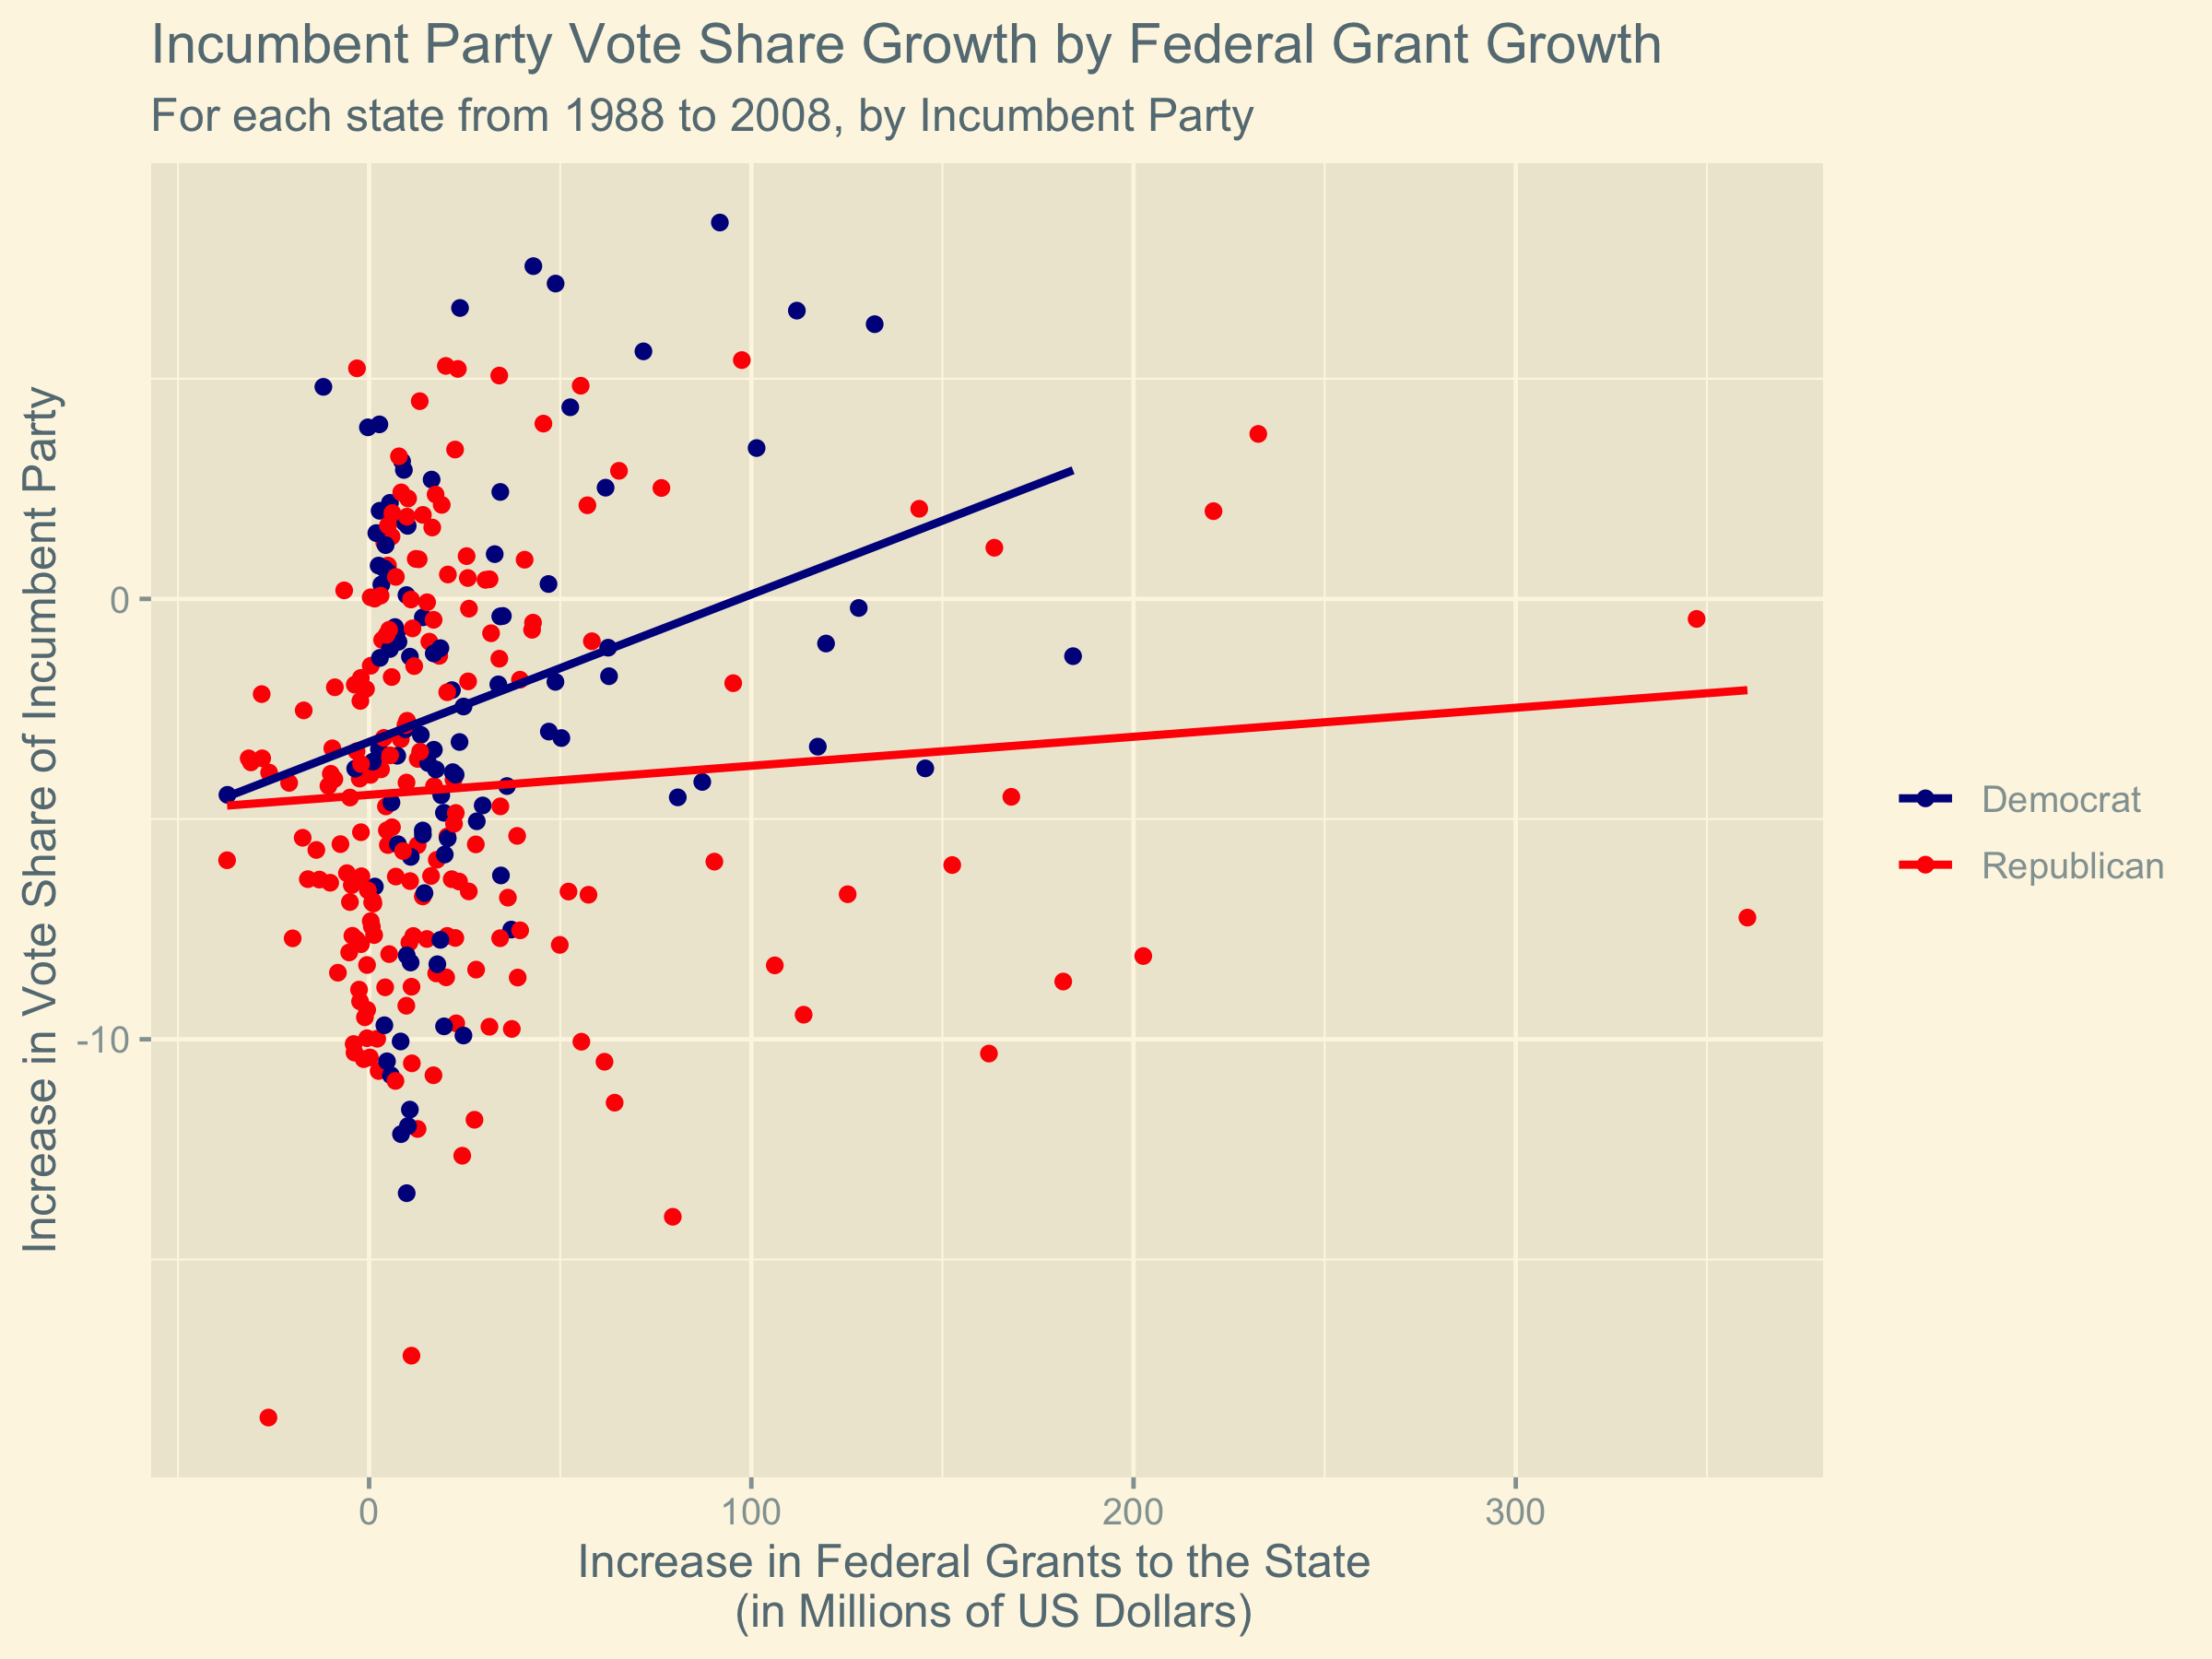
Now we can consider how this trend differs when the incumbent president is a Democrat or a Republican. (Note that in this plot, I do not consider whether the sitting president is running for reelection and I explain why I made this choice in the “Limitations” section below.)
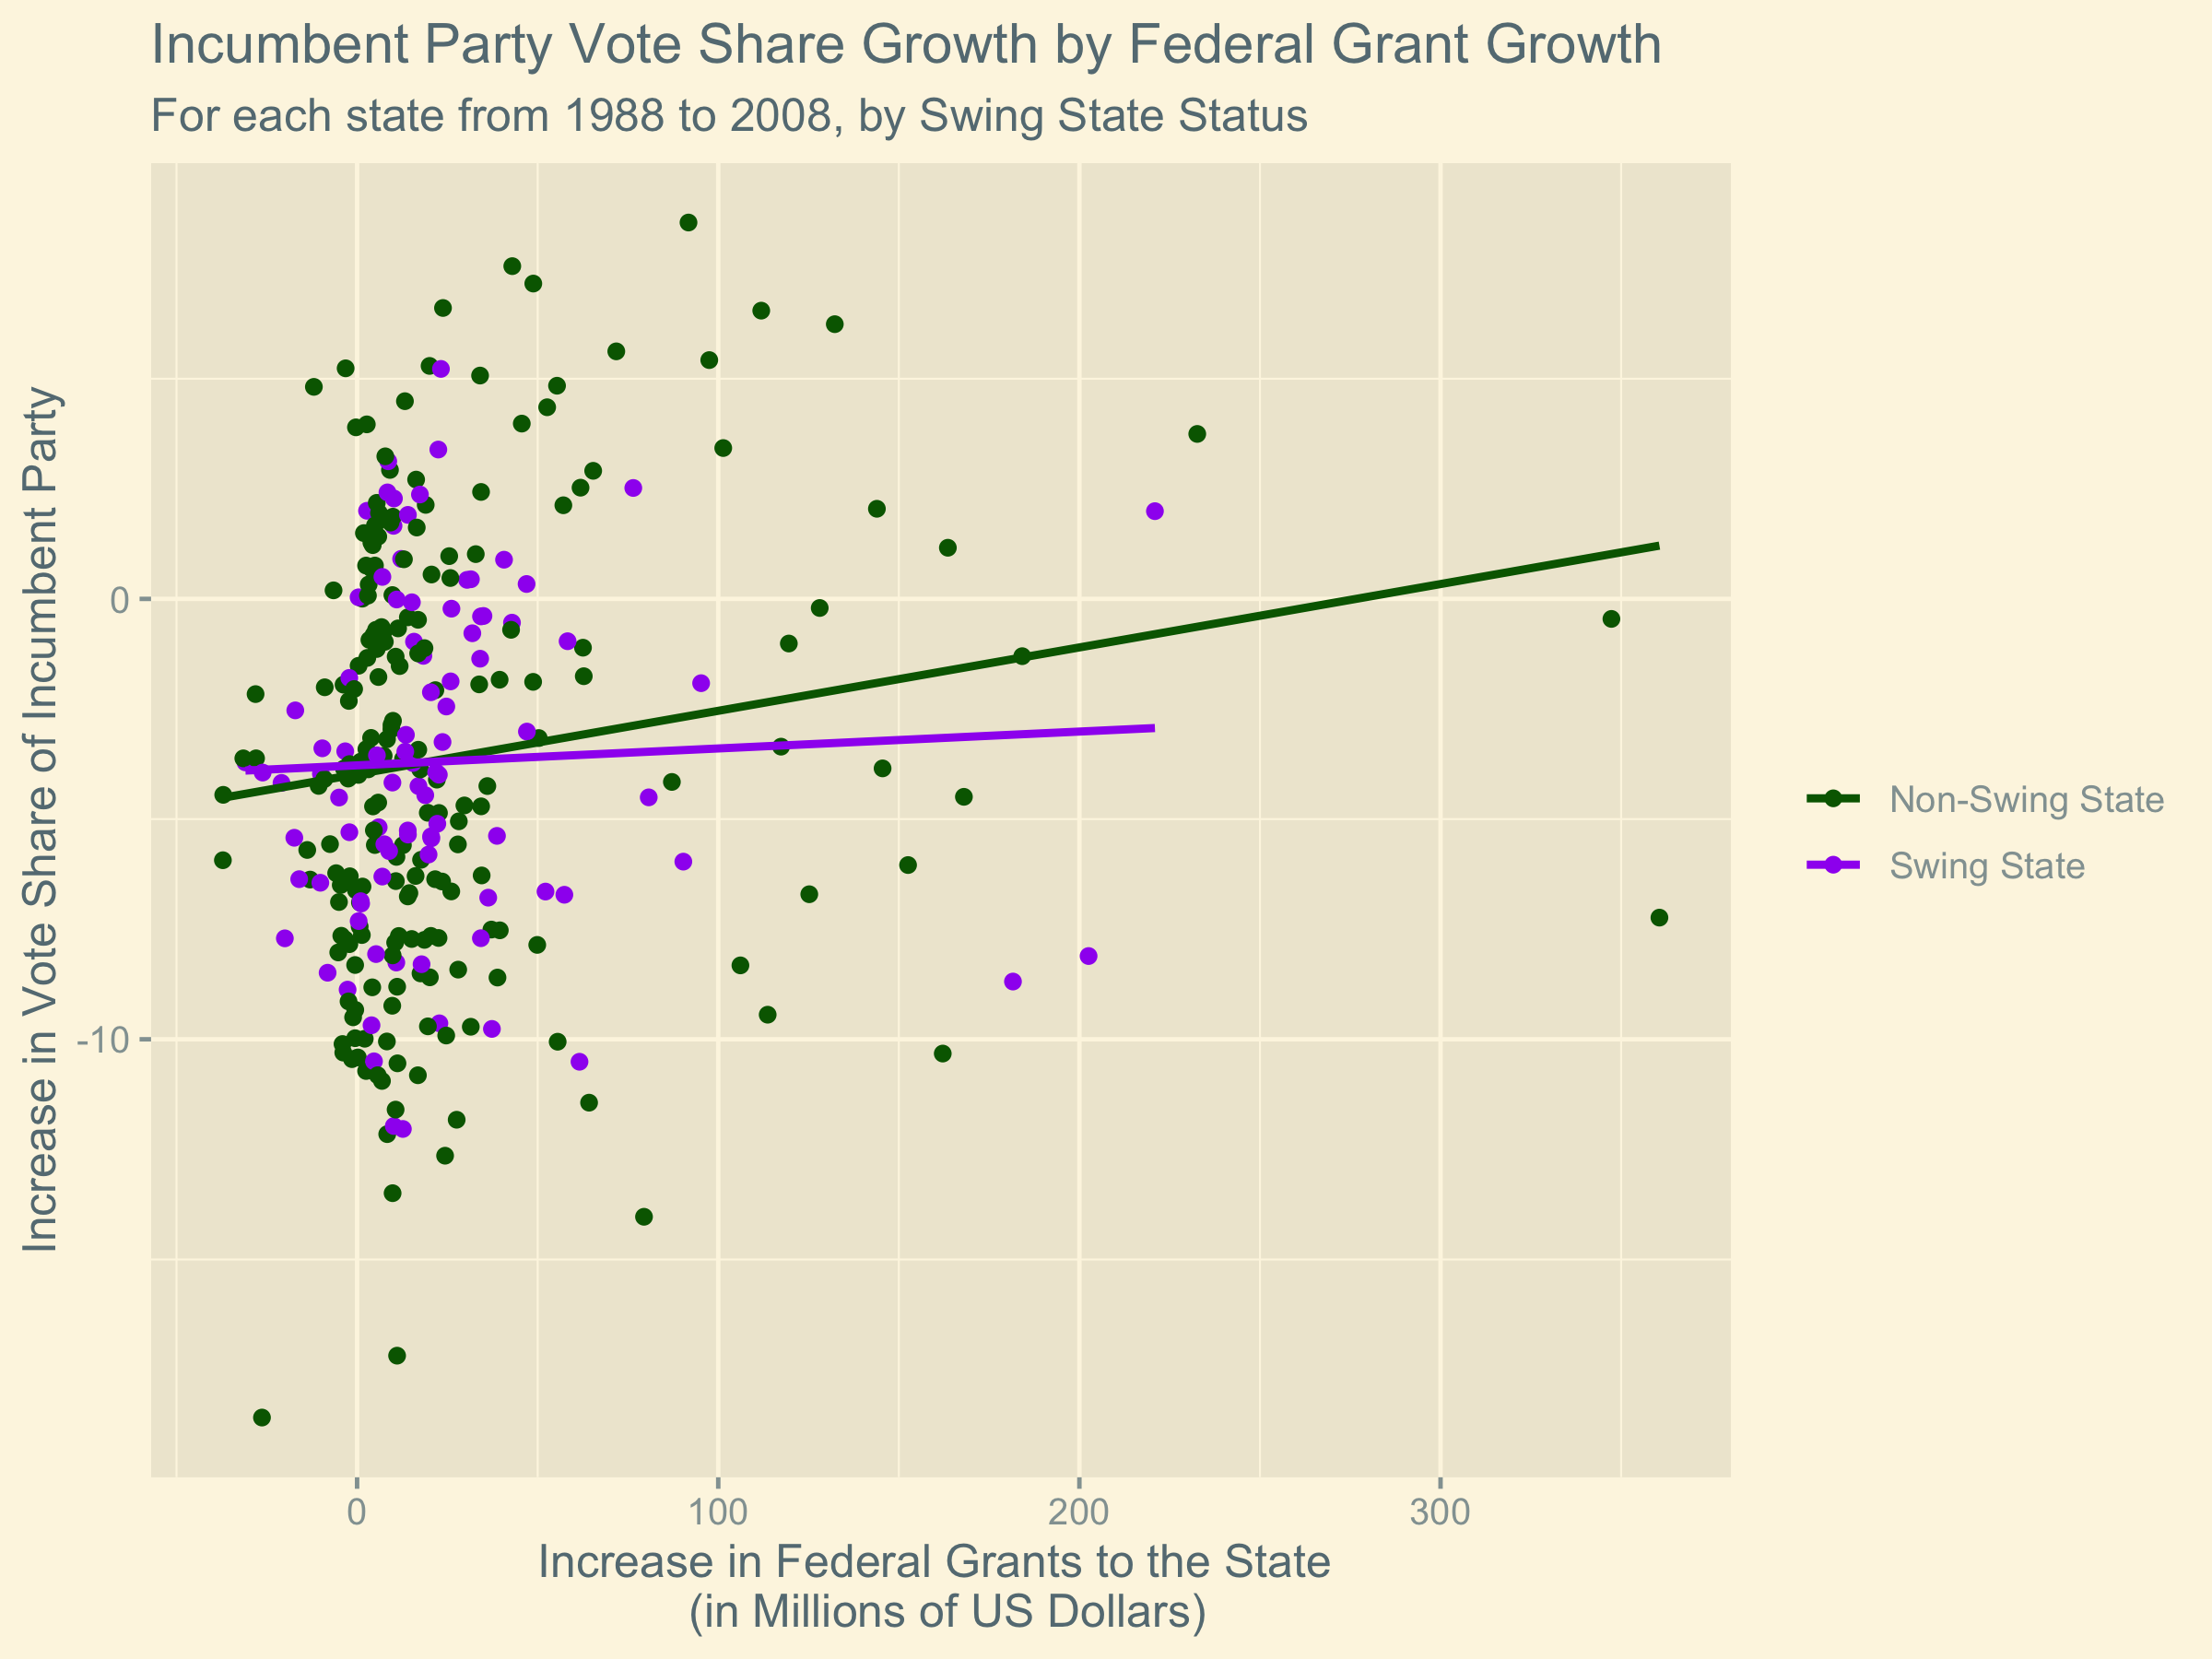
Now we can consider how this trend differs between swing states and non-swing states.
Interpretting the Plots
In the first figure, we observe that in general a greater increase in federal spending in a state results in a greater increase in the two party vote share of the incumbent party in the state. This result is consistent with our expectation: voters respond positively to the incumbent party when more money is spent in their state.
In the second figure, however, we see that the same increase in federal funding results in a greater increase in two-party vote share for Democrats than it does for Republicans. We can attempt to explain this by considering that the Democratic Party is known as the party of government spending moreso than the Republican Party. Because of this, voters might be more prone to attribute increased spending in their state to the Democrats than they would be for Republicans. This would explain why the regression line is steeper for Democrats than for Republicans.
Finally, in the third figure we see that the same increase in federal funding results in a lesser increase in incumbent two-party vote share for a swing state than for a non-swing state. We can explain this by considering that more campaign efforts are focused in swing states because that is where the election is ultimately decided. In the presence of other pressures supplied by the campaigns, the federal funding is a smaller piece of the factors that influence voters in a swing state than in a safe state where there is less campaign activity. Because of this, we see that it takes more money to see the same effect on the voter in a swing state.
Limitations
For all of the regression lines in the plots, the fit to the data is exceptionally weak. This means that there is a high probability for data to deviate from this trend. In other words, the relationship does not have a lot of predictive power. Also, the data used to generate these trends only spans from 1988 through 2008 which is a fairly small sample, making it harder to extrapolate with confidence. Additionally, with the large amounts of federal spending due to the coronavirus, it is possible that the virus supplies a confounding variable that will limit the extent to which the incumbent is rewarded for the allocation of federal funds to the states. Since coronavirus relief to each state is measured in billions of US dollars, we observe that 2020 would yield data far beyond the scope of the existing plots thereby making it even less reasonable to claim that we can expect the trends to hold.
Furthermore, it would have been useful to see if there were differences between the trends of the parties when we looked exclusively at incumbent candidates and not just at incumbent parties. However, due to the limited size of the data set, there would only be one Democratic incumbent and two Republican incumbents. These sample sizes would have been too small to be insightful because it would not have been possible to separate the effect of the party from the effect of the particular candidates as individuals.
In summary, any prediction made using these trends cannot be expected to forecast the election with great accuracy.
Conclusion
In conclusion, since change in federal spending is not strongly correlated with change in two-party popular vote share, it is not very reasonable to use federal spending as a predictor for the 2020 US presidential election. As such, the prediction I made last week using polling data remains a much more reasonable basis for predicting the election.