Election Analytics
Final Prediction
11/1/2020
With only days until the 2020 Presidential election, I will be making my final election prediction. In this post I will make a prediction about the two-party vote share in each state, the national two-party vote share, and the electoral vote result.
Basis for the Prediction
In a previous blog post I considered the effectiveness of polling. I found that state polling data tends to converge very well on the actual two party vote share for the state (and national polling data shows much less of a convergence). For this reason, I am using only state level October and November polling to make my state level vote share prediction. This is consistent with major forecasting models which tend to have polling dominate their model once the election is very close. This strategy makes sense because long before the election there is a lot more uncertainty about how the polls may change before election day so it is necessary to use other, more rigid factors to make the prediction more stable and to better account for the uncertainty. Since the polling uncertainty decreases very close to the election, we do not need more variables to have strong predictive power.
In summary my model makes a prediction on the two-party vote share of each candidate in each state based on their polling average (as given on 538 on 10/30/2020)
As a consequence, the model I am using for this prediction is not the most useful model when trying to predict the election long before election day because, of course, October and November polling data will not be available yet. However, close to the election, this is a reasonable basis for a prediction.
To predict the national two-party vote share, I use the predicted state level two-party vote shares and weight them by the size of their voting eligible populations (VEP). Although this method does not account for possible differences in turnout between states, historical data indicates that state level two-party vote shares aggregate to a close estimate of the national two-party vote share despite the possibility of different turnout rates.
To predict the final electoral vote share and map, I will again start with my predicted state-level two-party vote shares. I will generate win odds for Trump in each state by looking at historical data for how often a candidate wins with different polling numbers. I will estimate of Donald Trump’s win odds for the overall 2020 presidential election by simulating the election 10,000 times with the state win probabilities found from the polling data.
The Model
State-Level Two-Party Vote Share
To predict the state level two-party vote share, I perform a linear regression on the relationship between polling in the October and November and the actual two-party vote share in that election. In cases where there was no polling data available in October or November, I used the average polling from the month closest to the election. The data I used includes elections from 1976 to 2016.
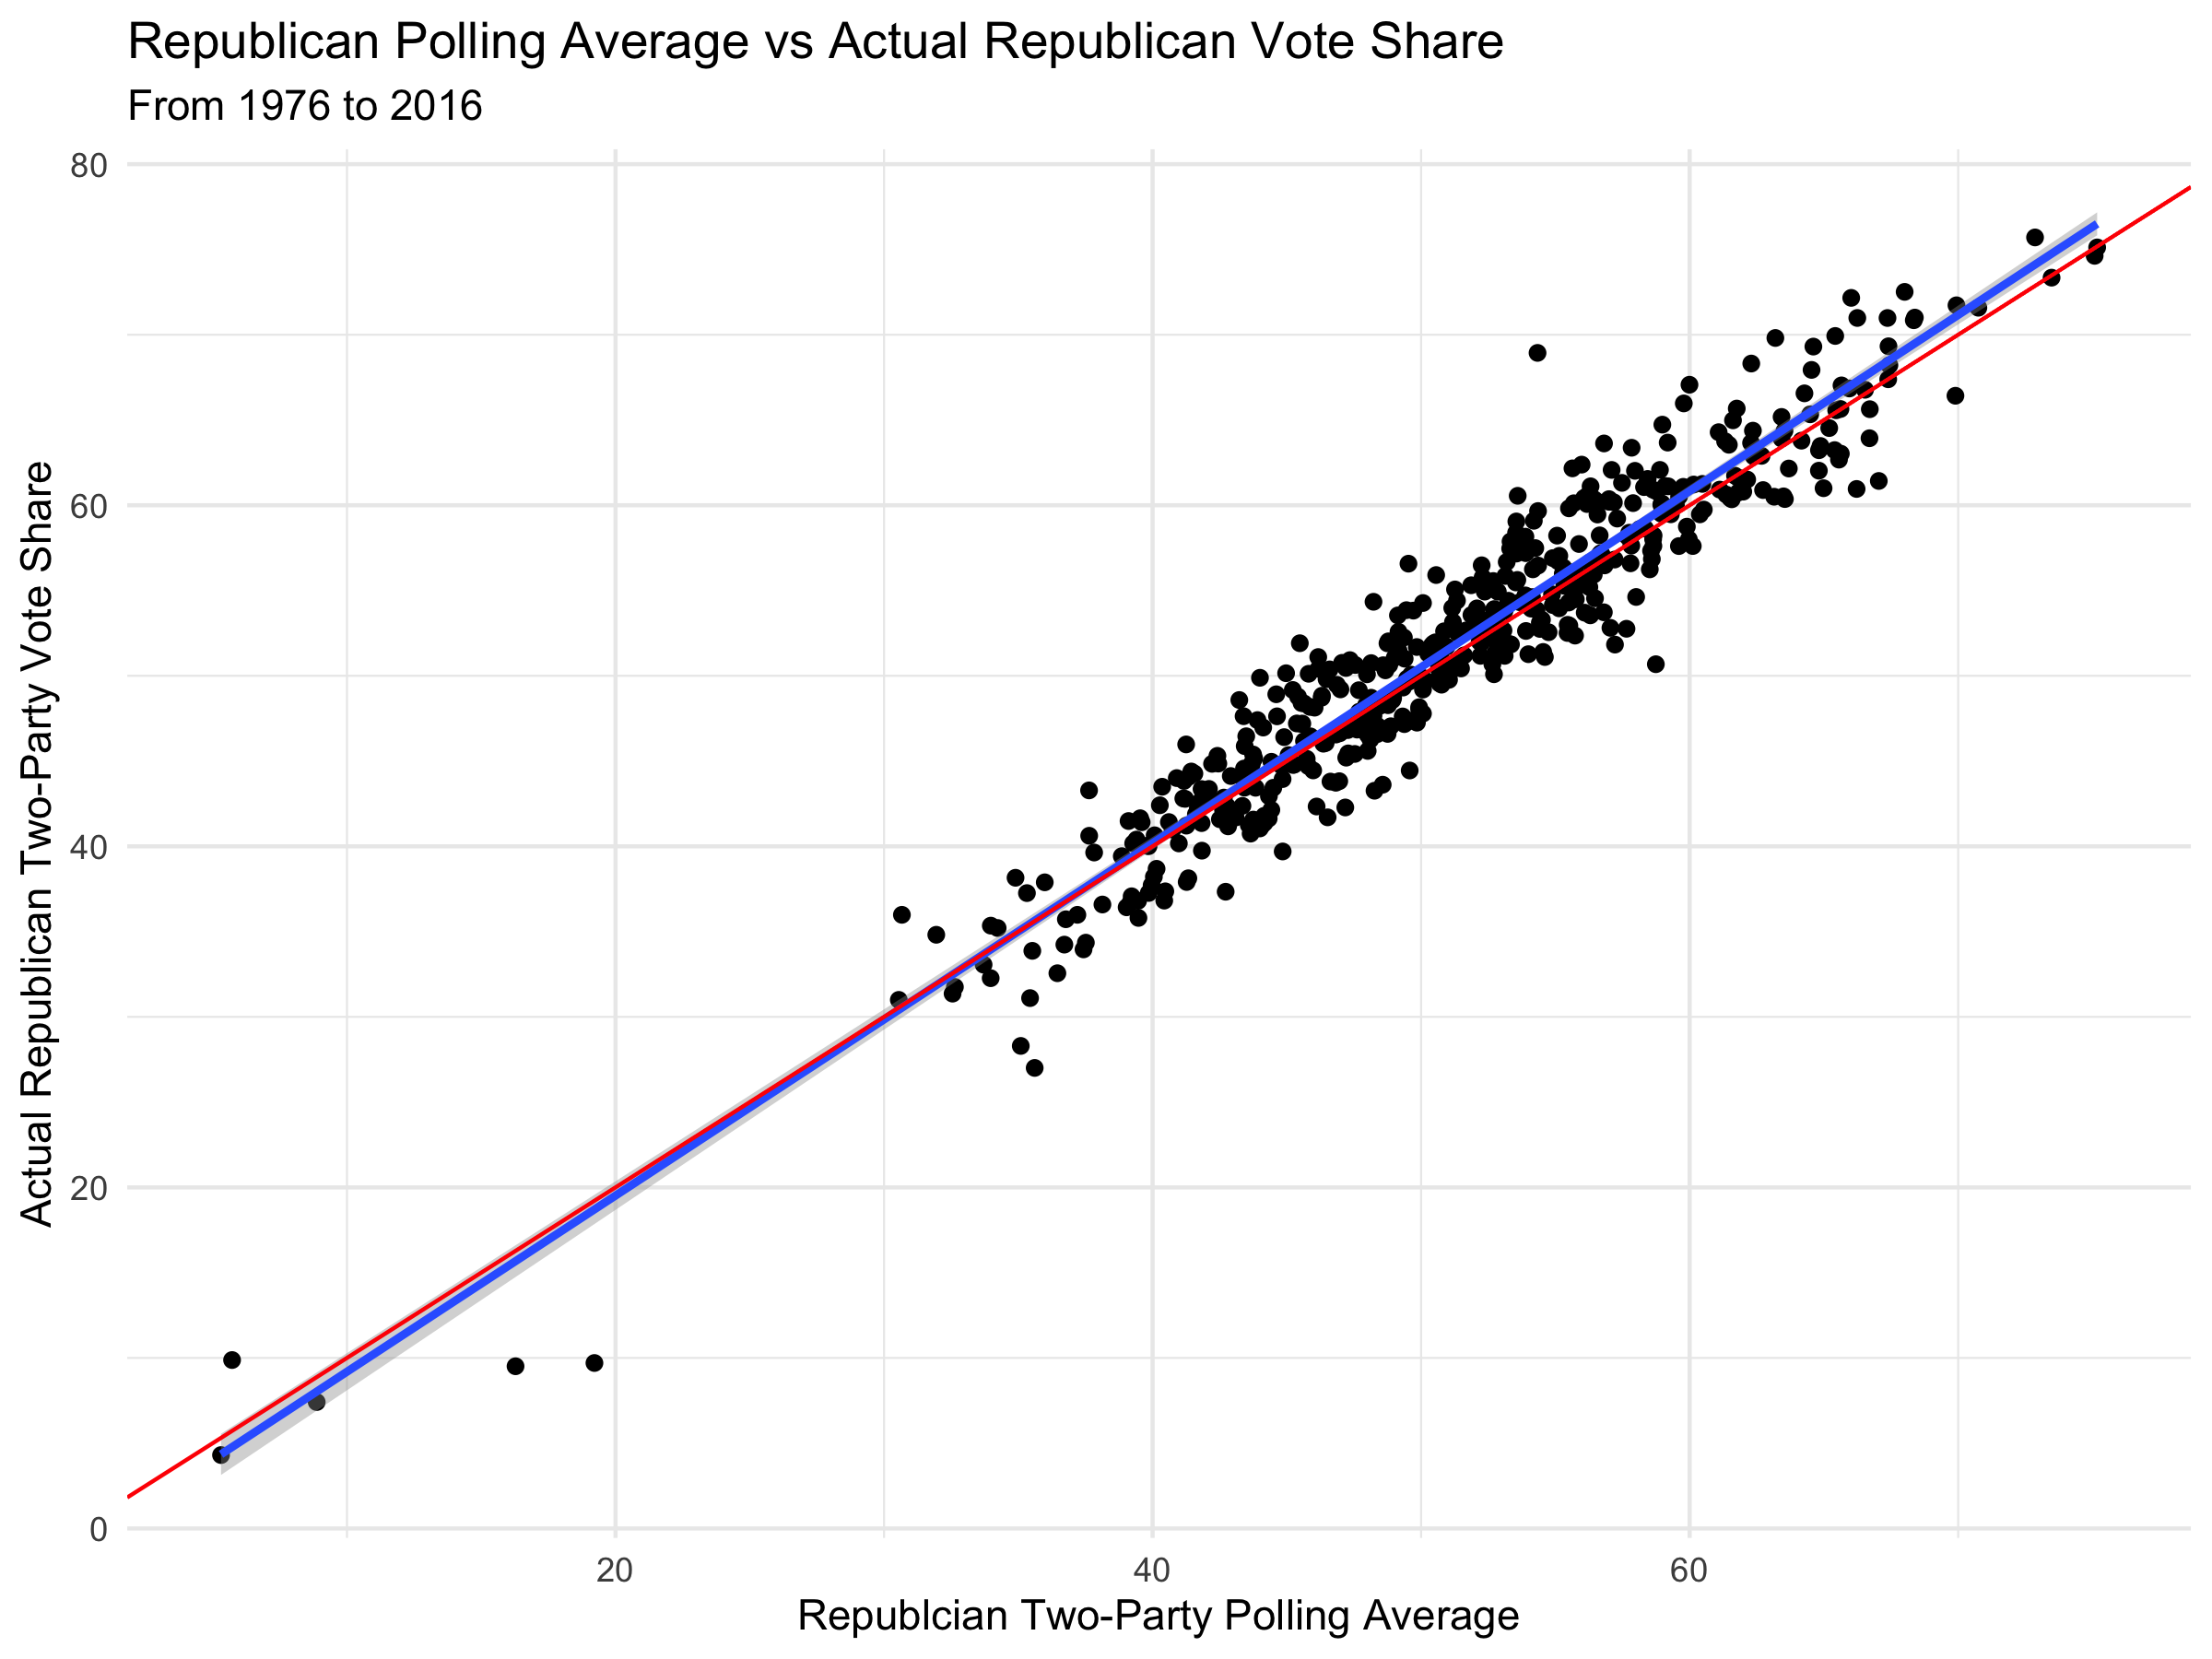
In the figure, the red line shows the line Vote Share = Polling Average and the blue line shows the regression line.
The regression line is given by the equation:
Republican Vote Share = 1.03279*(Republican Polling Average) - 1.13674
First we note that this line is fairly close to the line of Vote Share = Polling Average. This makes sense because both vote share and polling average are measures of which candidate people want to win. This explains why the slope is positive. We can interpret the coefficients as corrections for the way in which polling tends to be wrong historically. In particular we observe that if Republicans and Democrats are polling equivalently (50% for each party), then the Republican is predicted to get a higher two-party vote share. This means that my model is adjusting for the fact that in close races, the polling tends to expect a higher Democratic vote share than tends to result.
Validation
The adjusted rsquared value for the regression line is 0.925. This means that the in-sample fit of the line is very strong. Furthermore, by performing leave-one-out cross validation I found the model has an rsquared of 0.924 and a root mean squared error of 2.734. This means that the out-of-sample fit for the line is also very strong.
In other words, it is reasonable to use this as my model for predicting the state two-party popular vote shares. However, it is worth noting that predictions made with this model will carry uncertainty that is quantified by the RMSE of 2.734.
Making a Prediction
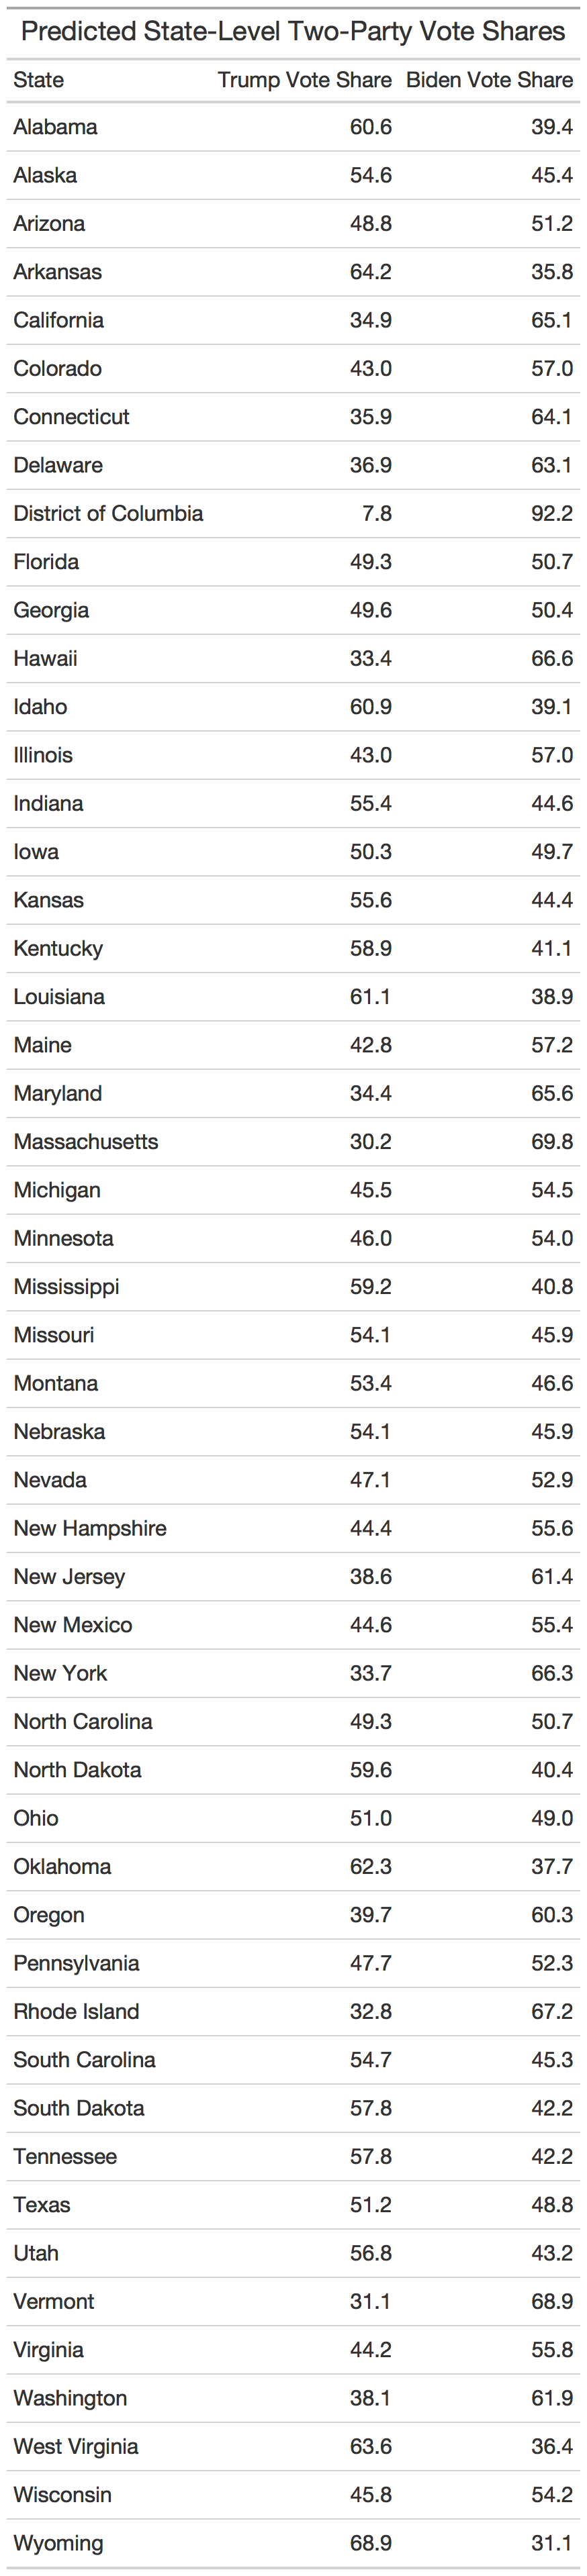
Now we can use this regression to predict the two-party vote in each state. In looking at the following table, recall that each prediction has an RMSE of 2.734. All vote shares are given as percentages.
Aggregating these predictions into a map, we get a predicted electoral map of:
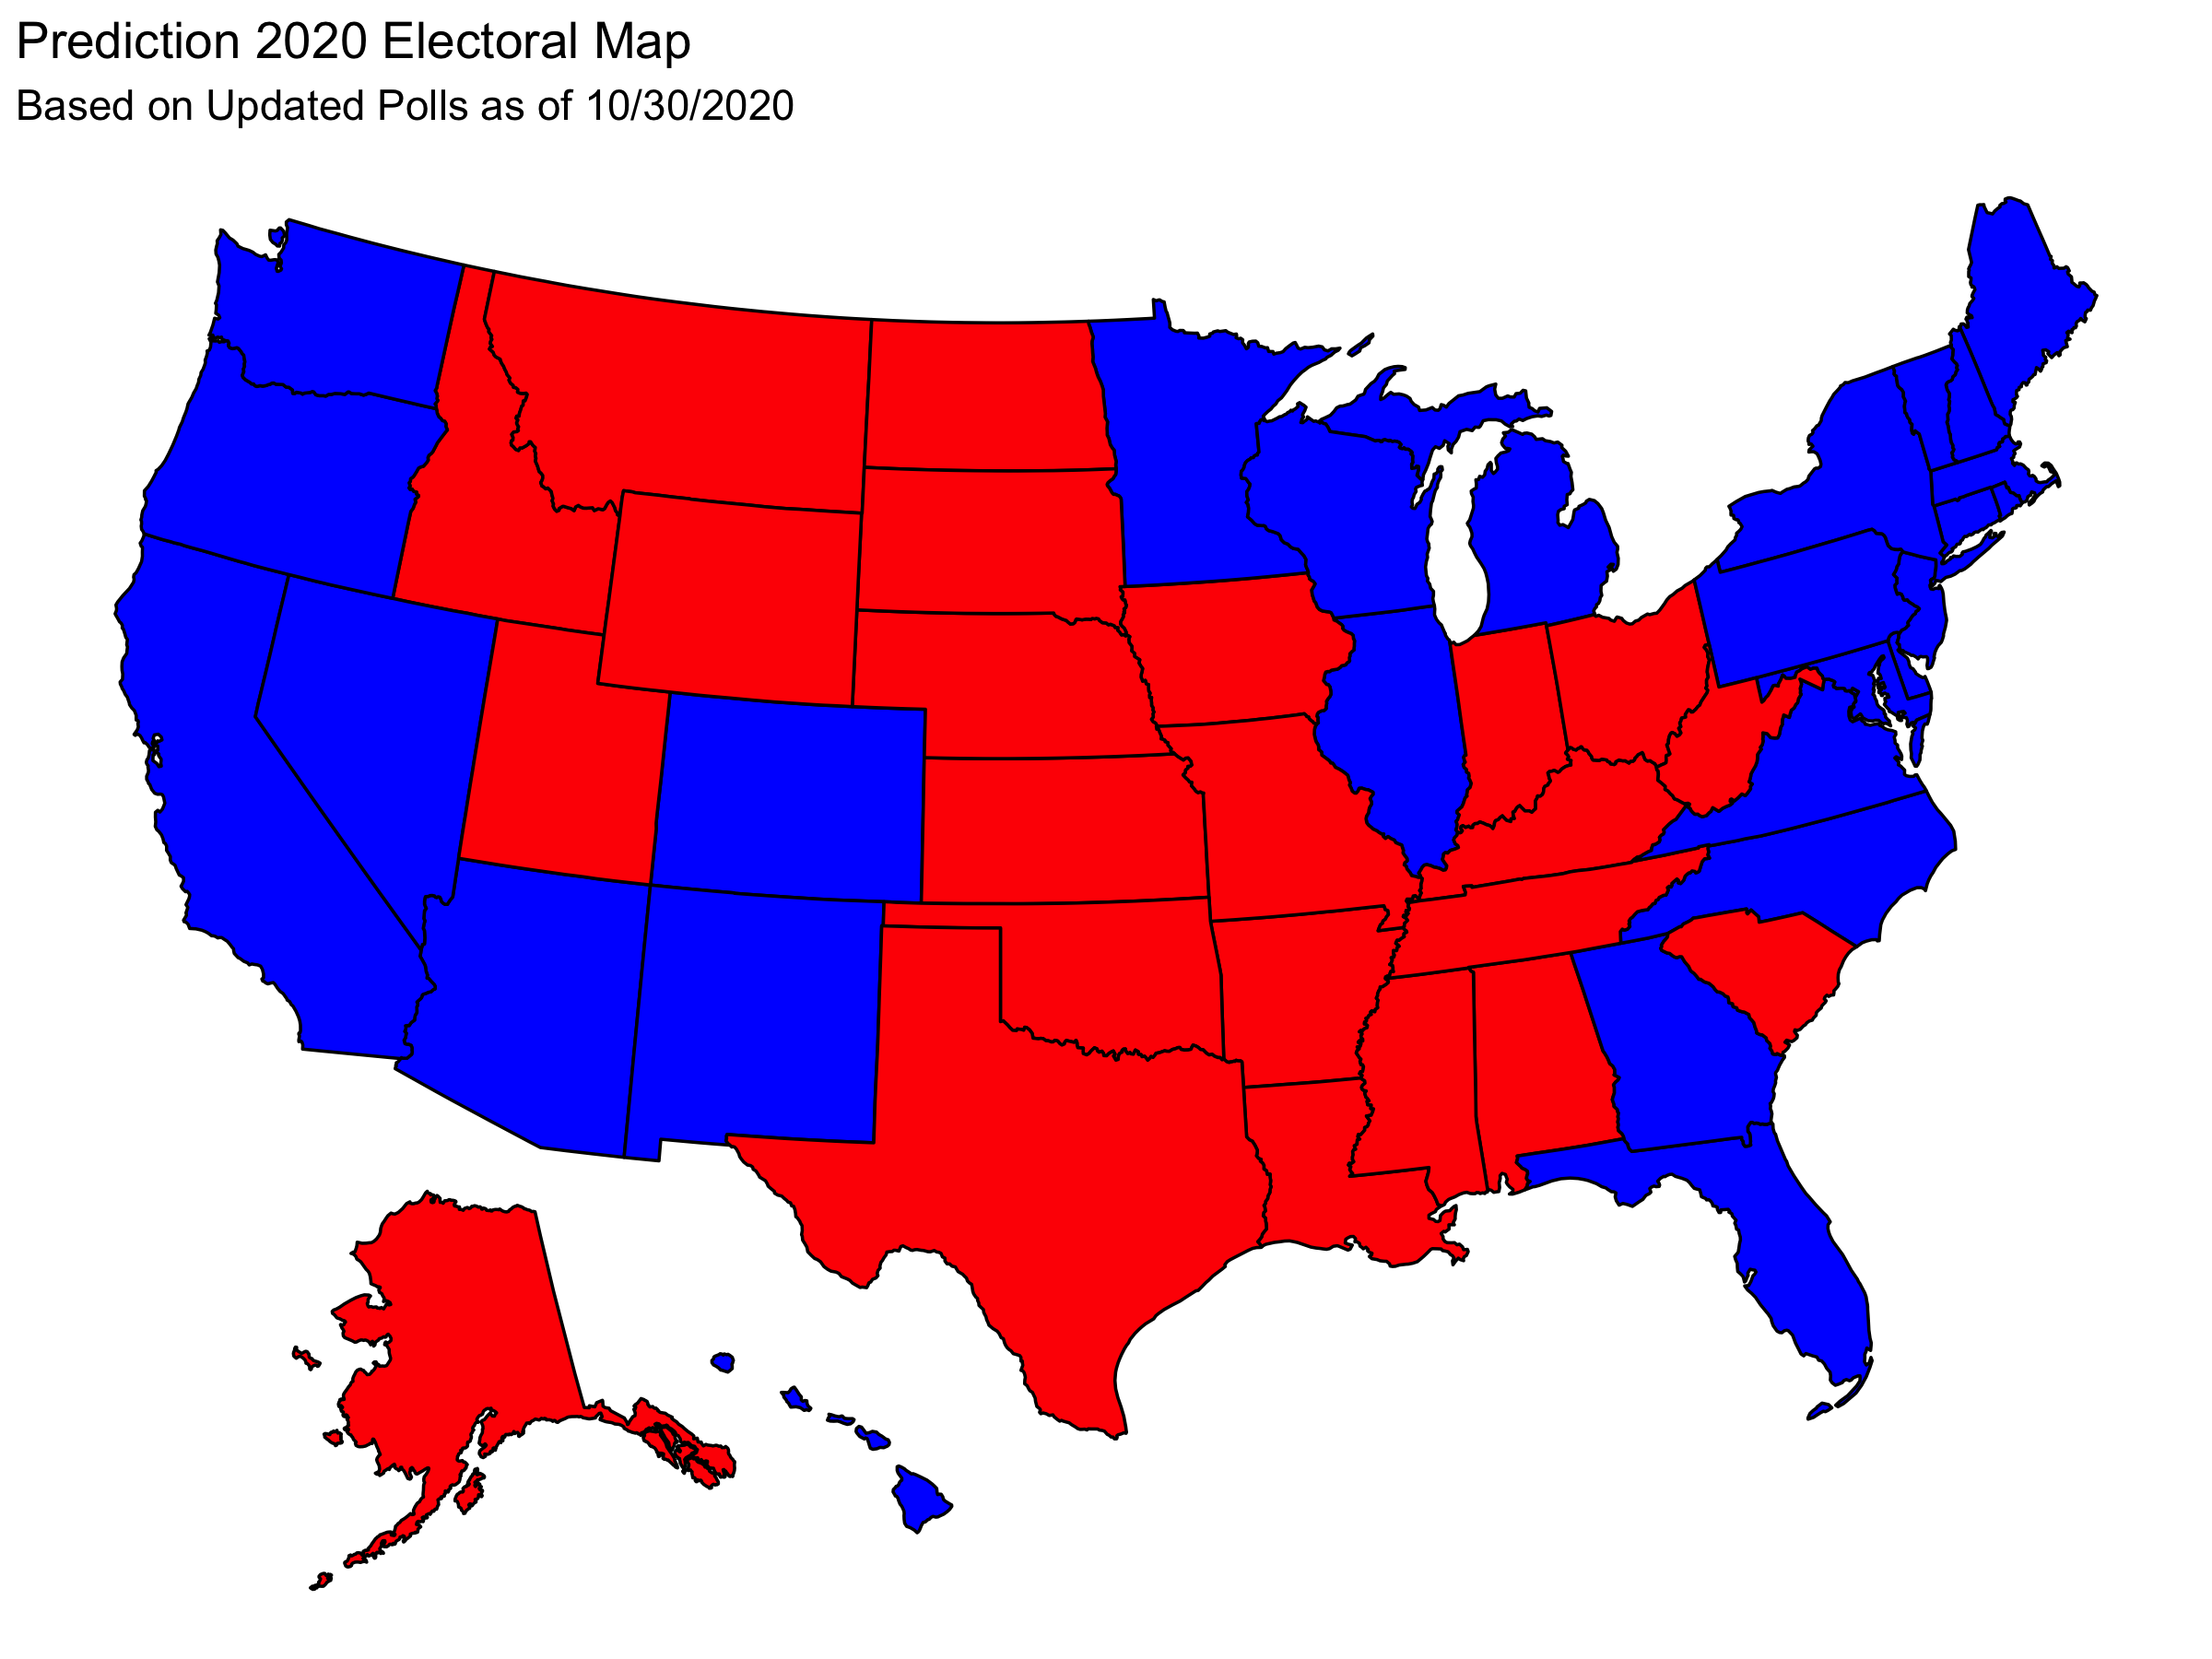
This gives an electoral result of:
| Candidate | Electoral Votes |
|---|---|
| Trump | 188 |
| Biden | 350 |
This means that my prediction is that Biden Wins the 2020 Presidential Election.
However, again it is worth recalling that each of the state two-party popular vote percentages has uncertainty. In particular, if we color states purple when their predicted two party vote share is within one RMSE of flipping which candidate wins, we get the following election map:
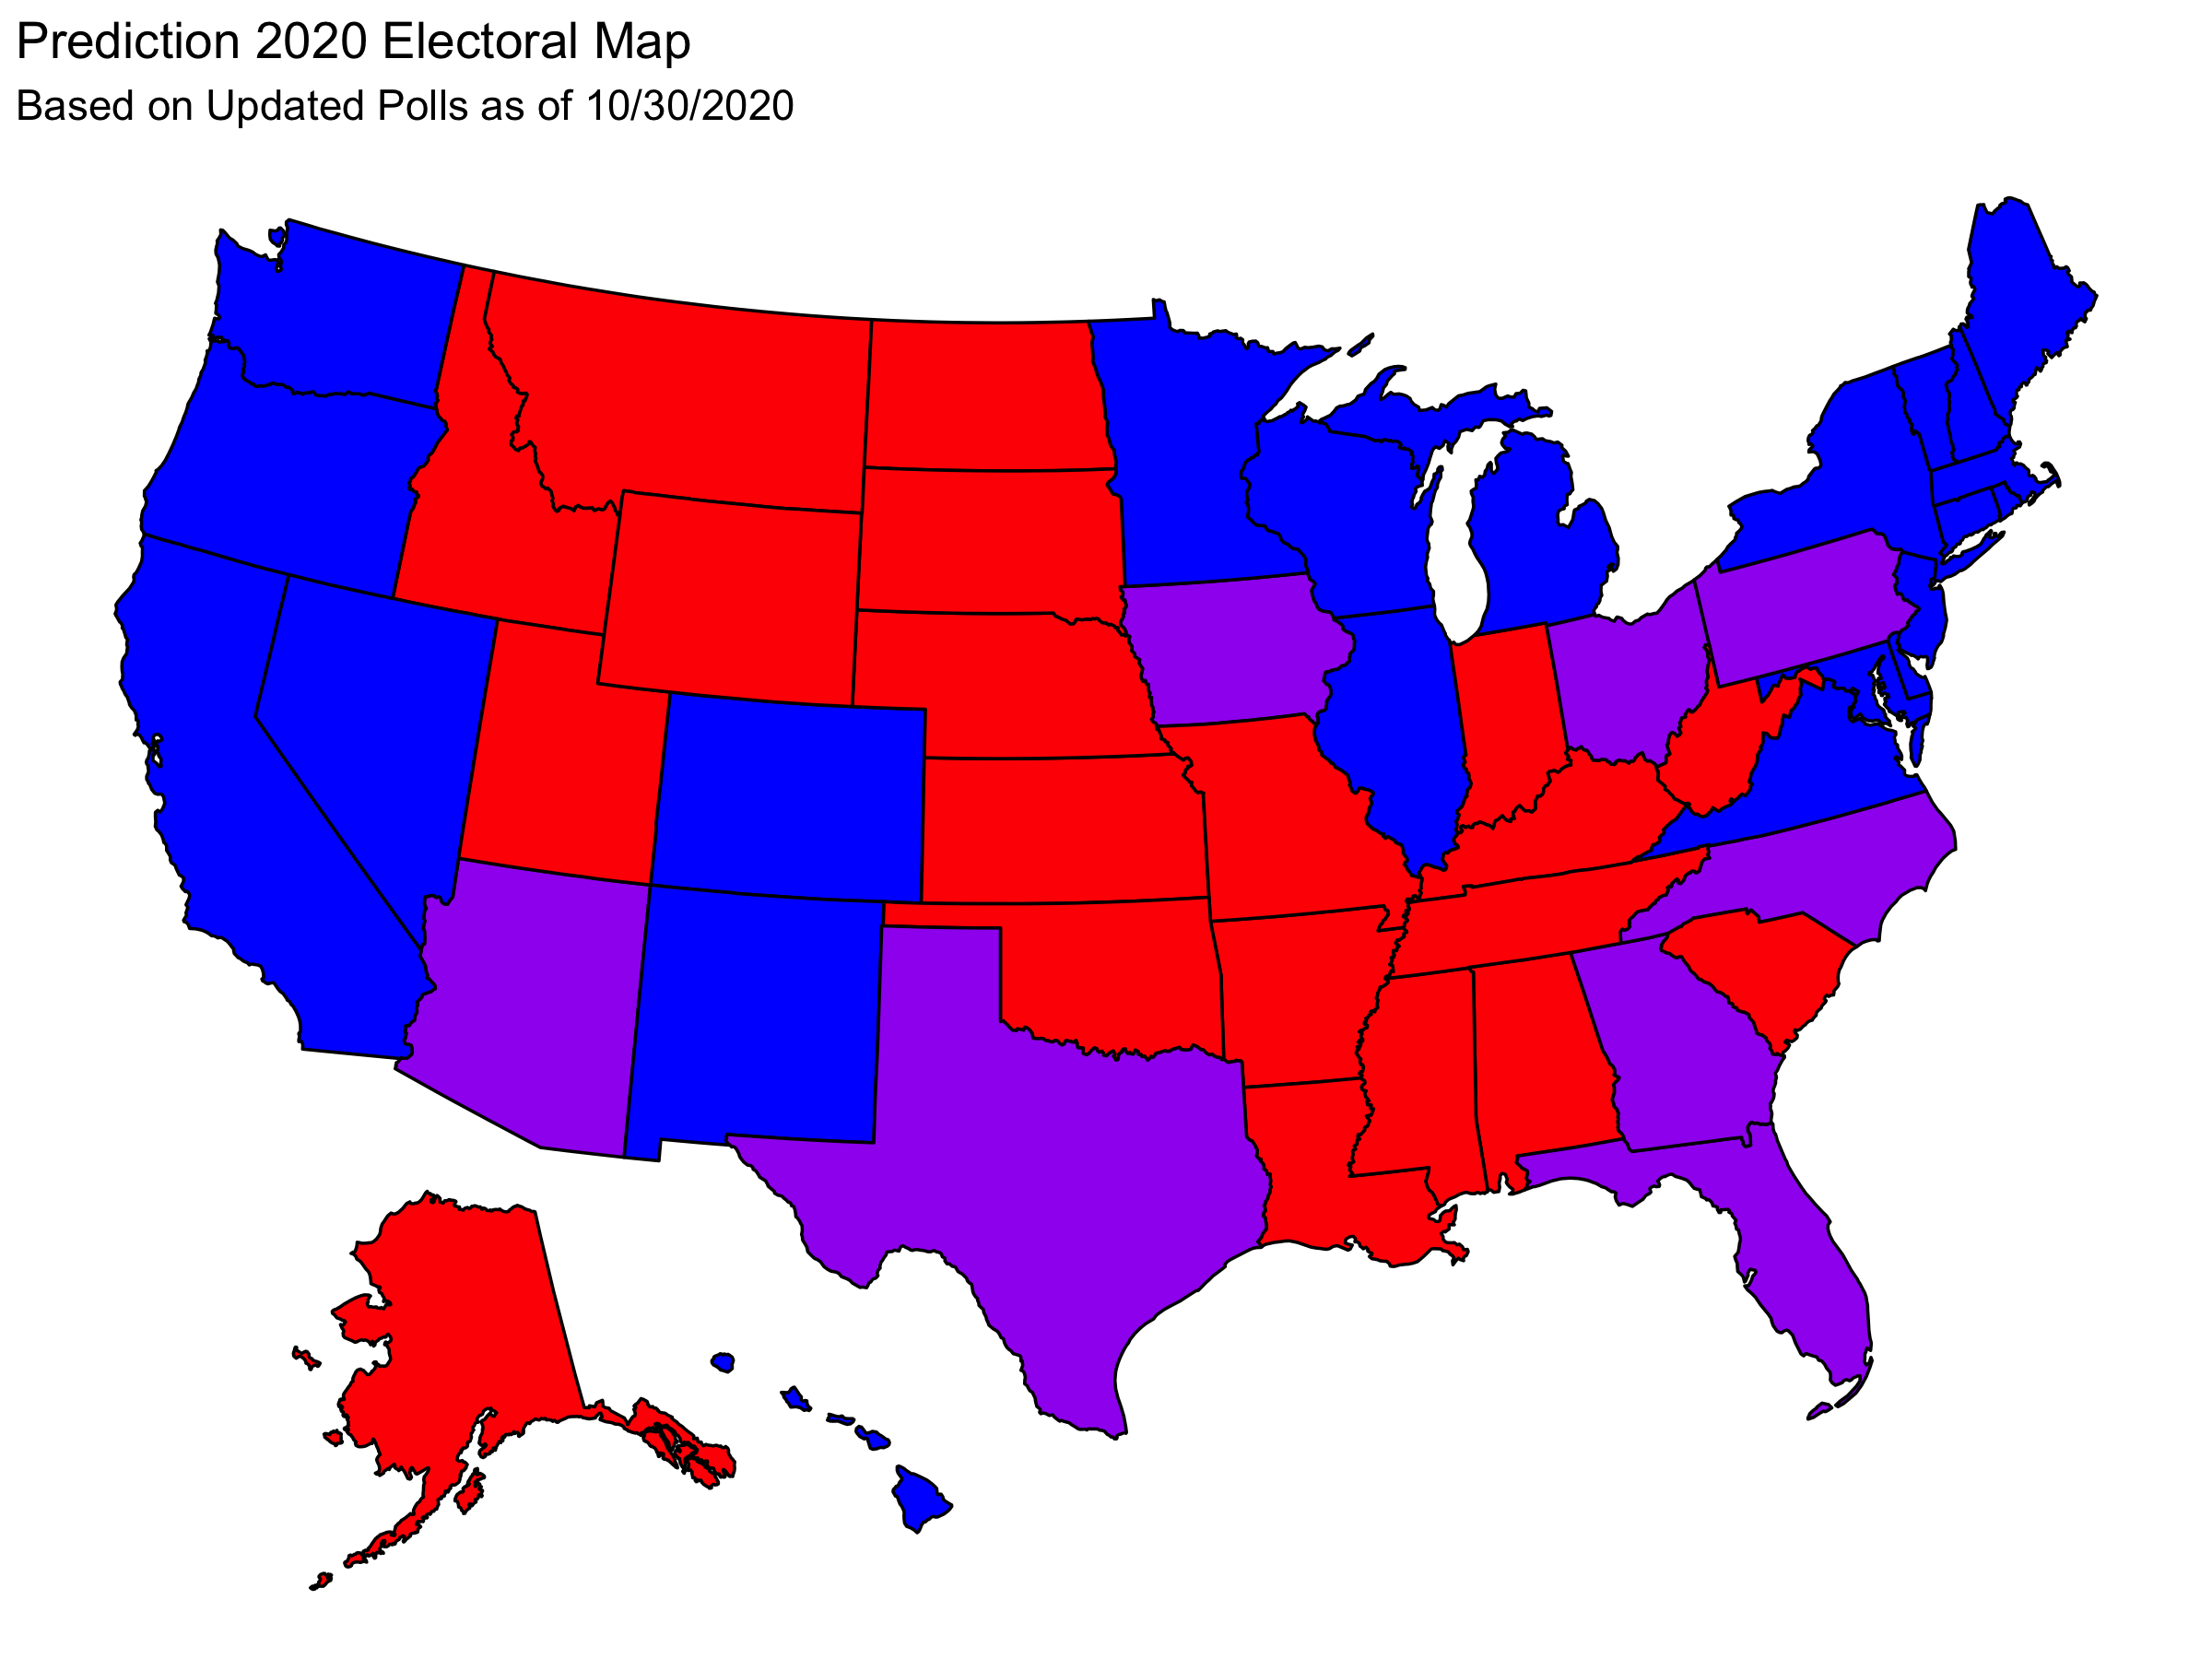
This helps us to see the uncertainty. The states that are decided by less than a reasonable margin of error contain enough electoral votes to entirely flip the result of the election (because in the map there are 259 blue electors, 153 purple electors, and 126 red electors).
National Two-Party Vote Share
First, consider whether it is reasonable that we use our state-level two-party vote share to predict the national vote share. Below I compare the national vote share given by weighting each state vote share by it’s VEP to the actual national vote share in that election.
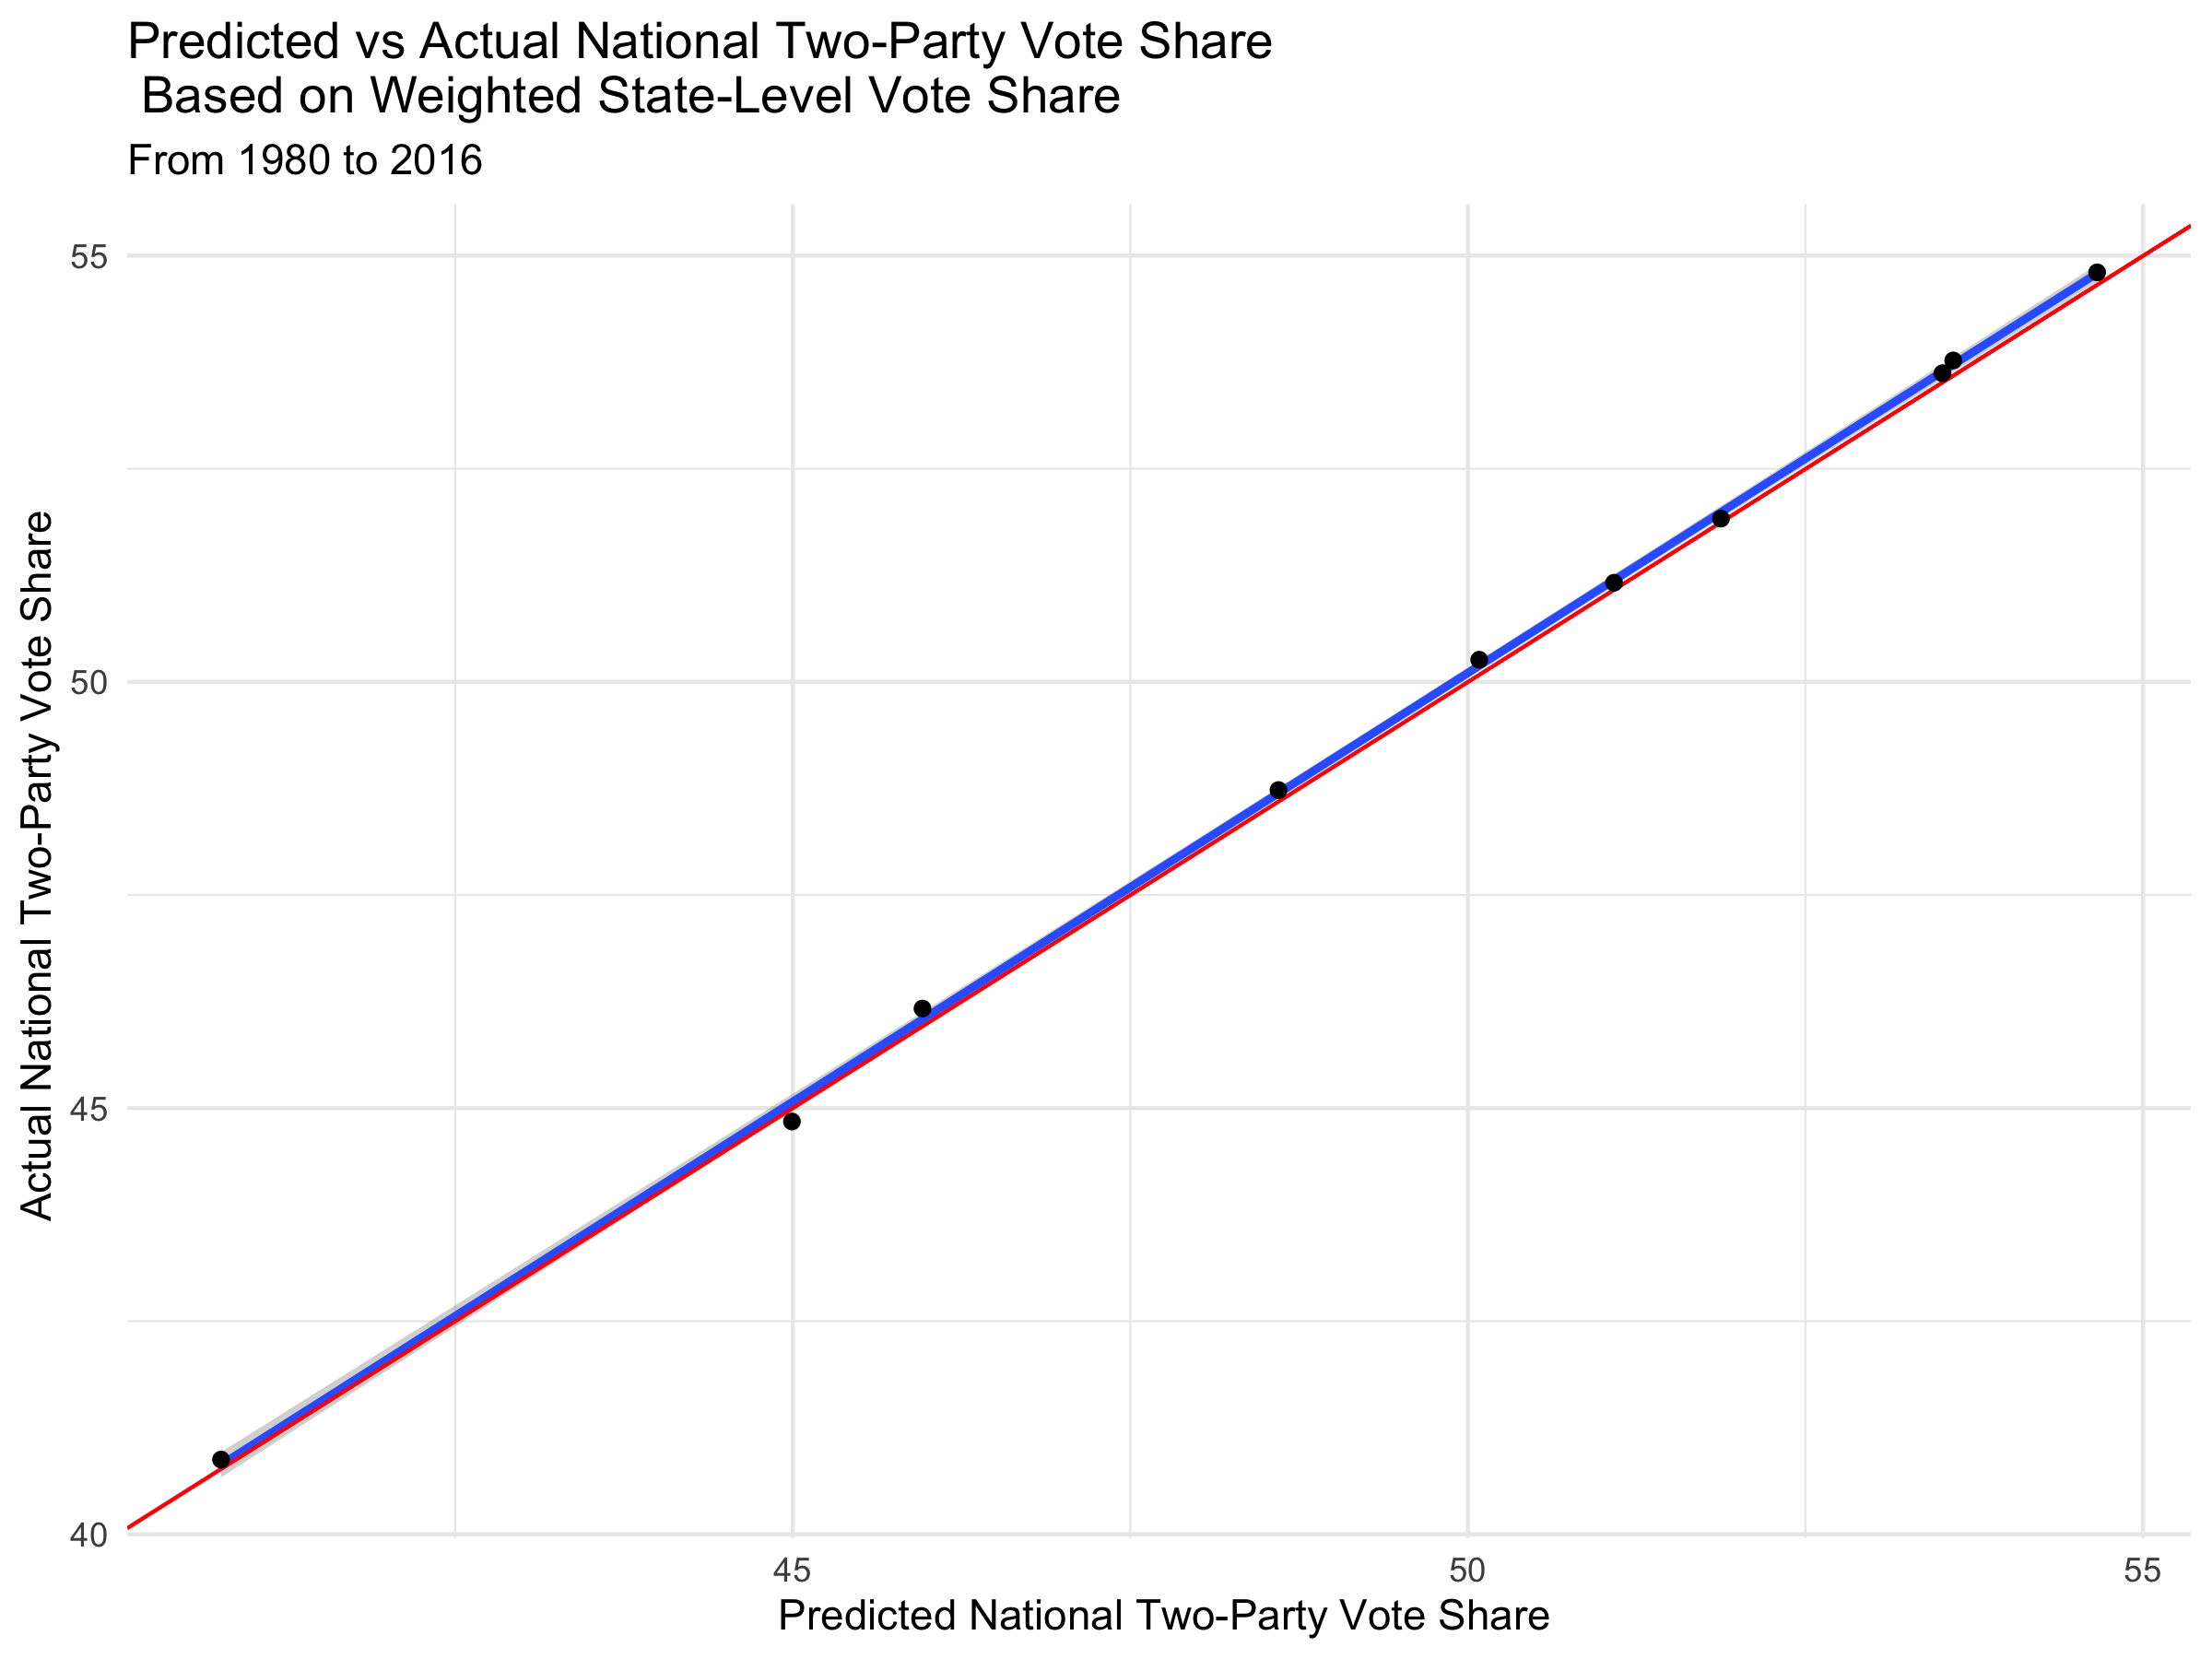
We see the relationship is very strong and that the regression line (in blue) effectively matches the line y = x indicating that it is reasonable that we use our state-level two-party vote share to predict the national vote share.
Now we can use our state level predictions to generate a prediction for the national two party vote share of the two candidates using 2020 VEP data. Using this weighting we predict the following result for national two party vote share:
| Candidate | National Two-Party Vote Share |
|---|---|
| Trump | 46.1 |
| Biden | 53.9 |
It is difficult to quantify the uncertainty on this prediction because there is uncertainty both from the fact that I am using predicted two-party vote share instead of actual two-party vote share, and from the fact that there may be different voter turnouts in each state. Recall from above that each of the state popular vote predictions has a root mean squared error (RMSE) of 2.73; we can use this as a sort of proxy for error in this prediction. We observe that Trump’s predicted two-party popular vote share is within two RMSE of giving him a majority of the vote. This means that I predict Biden will win the national two-party vote, but there is still a reasonable probability that Trump wins the national two-party popular vote.
Electoral Vote Prediction
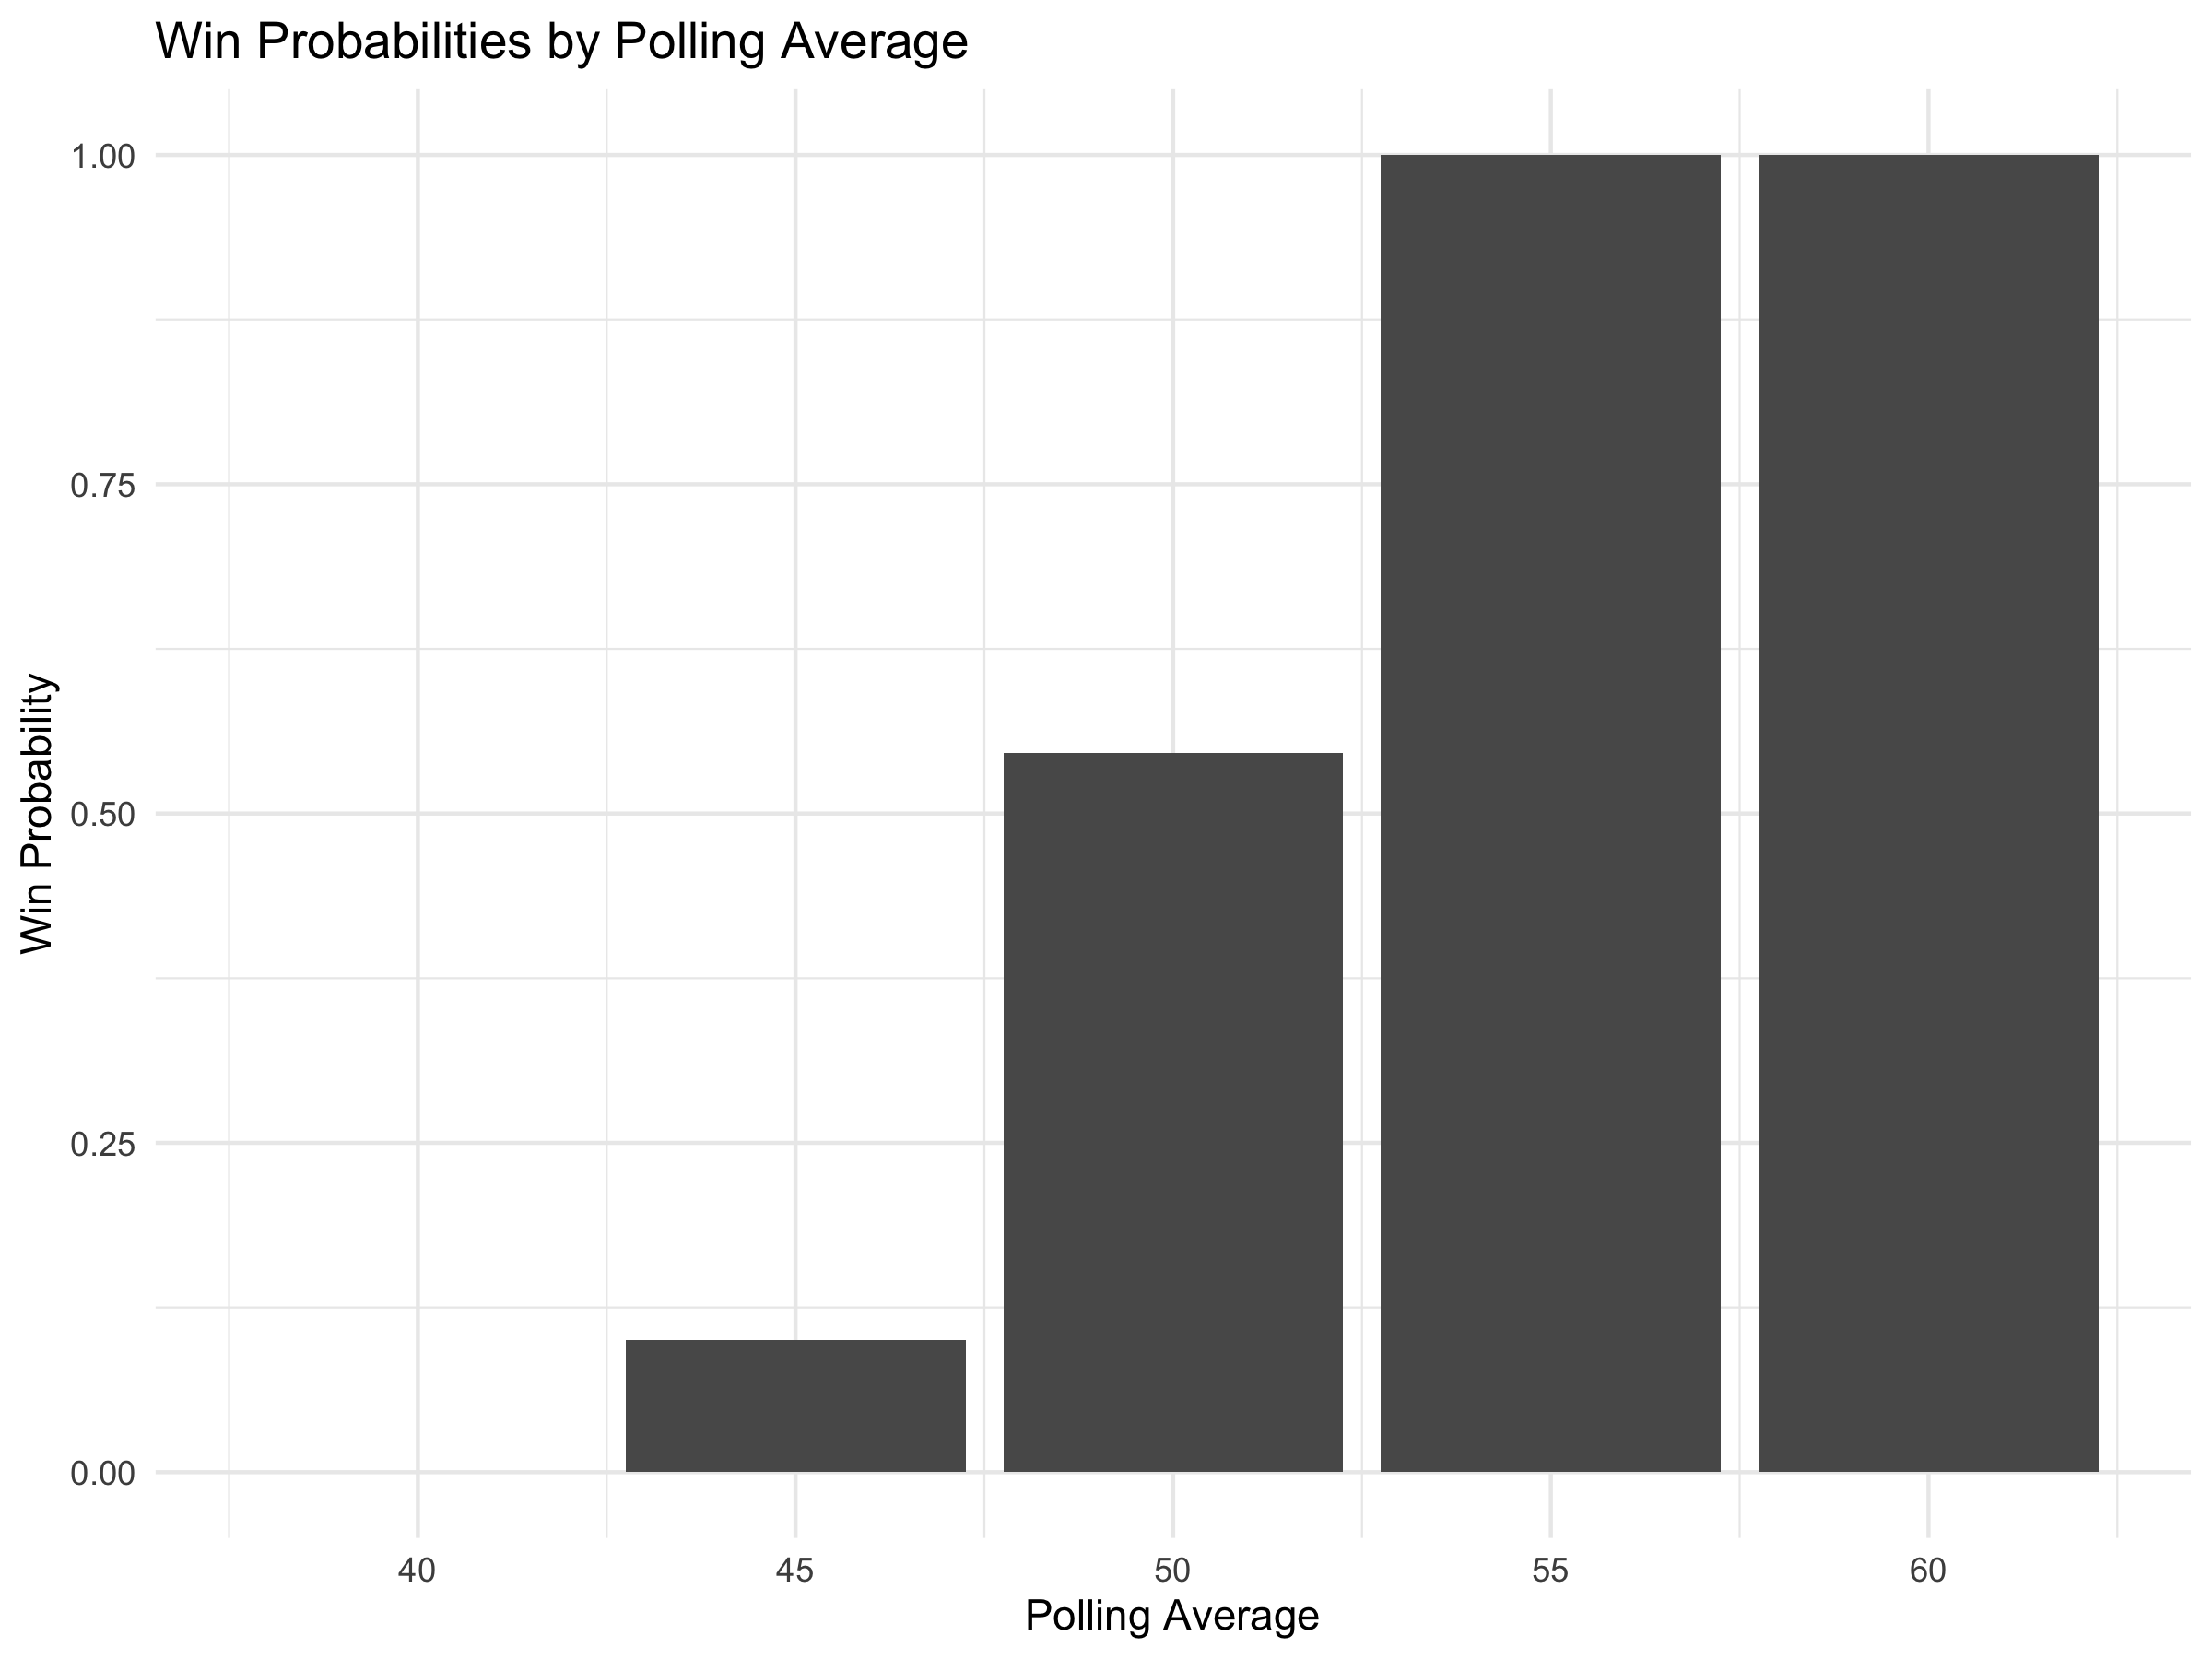
From historical data on how often candidates win a state with a particular polling average, I generate a plot of win probabilities based on polling in that state.
I simulated the election 10,000 times using the win probabilities determined by current polling averages and historical data on win rates for states with these polling averages.
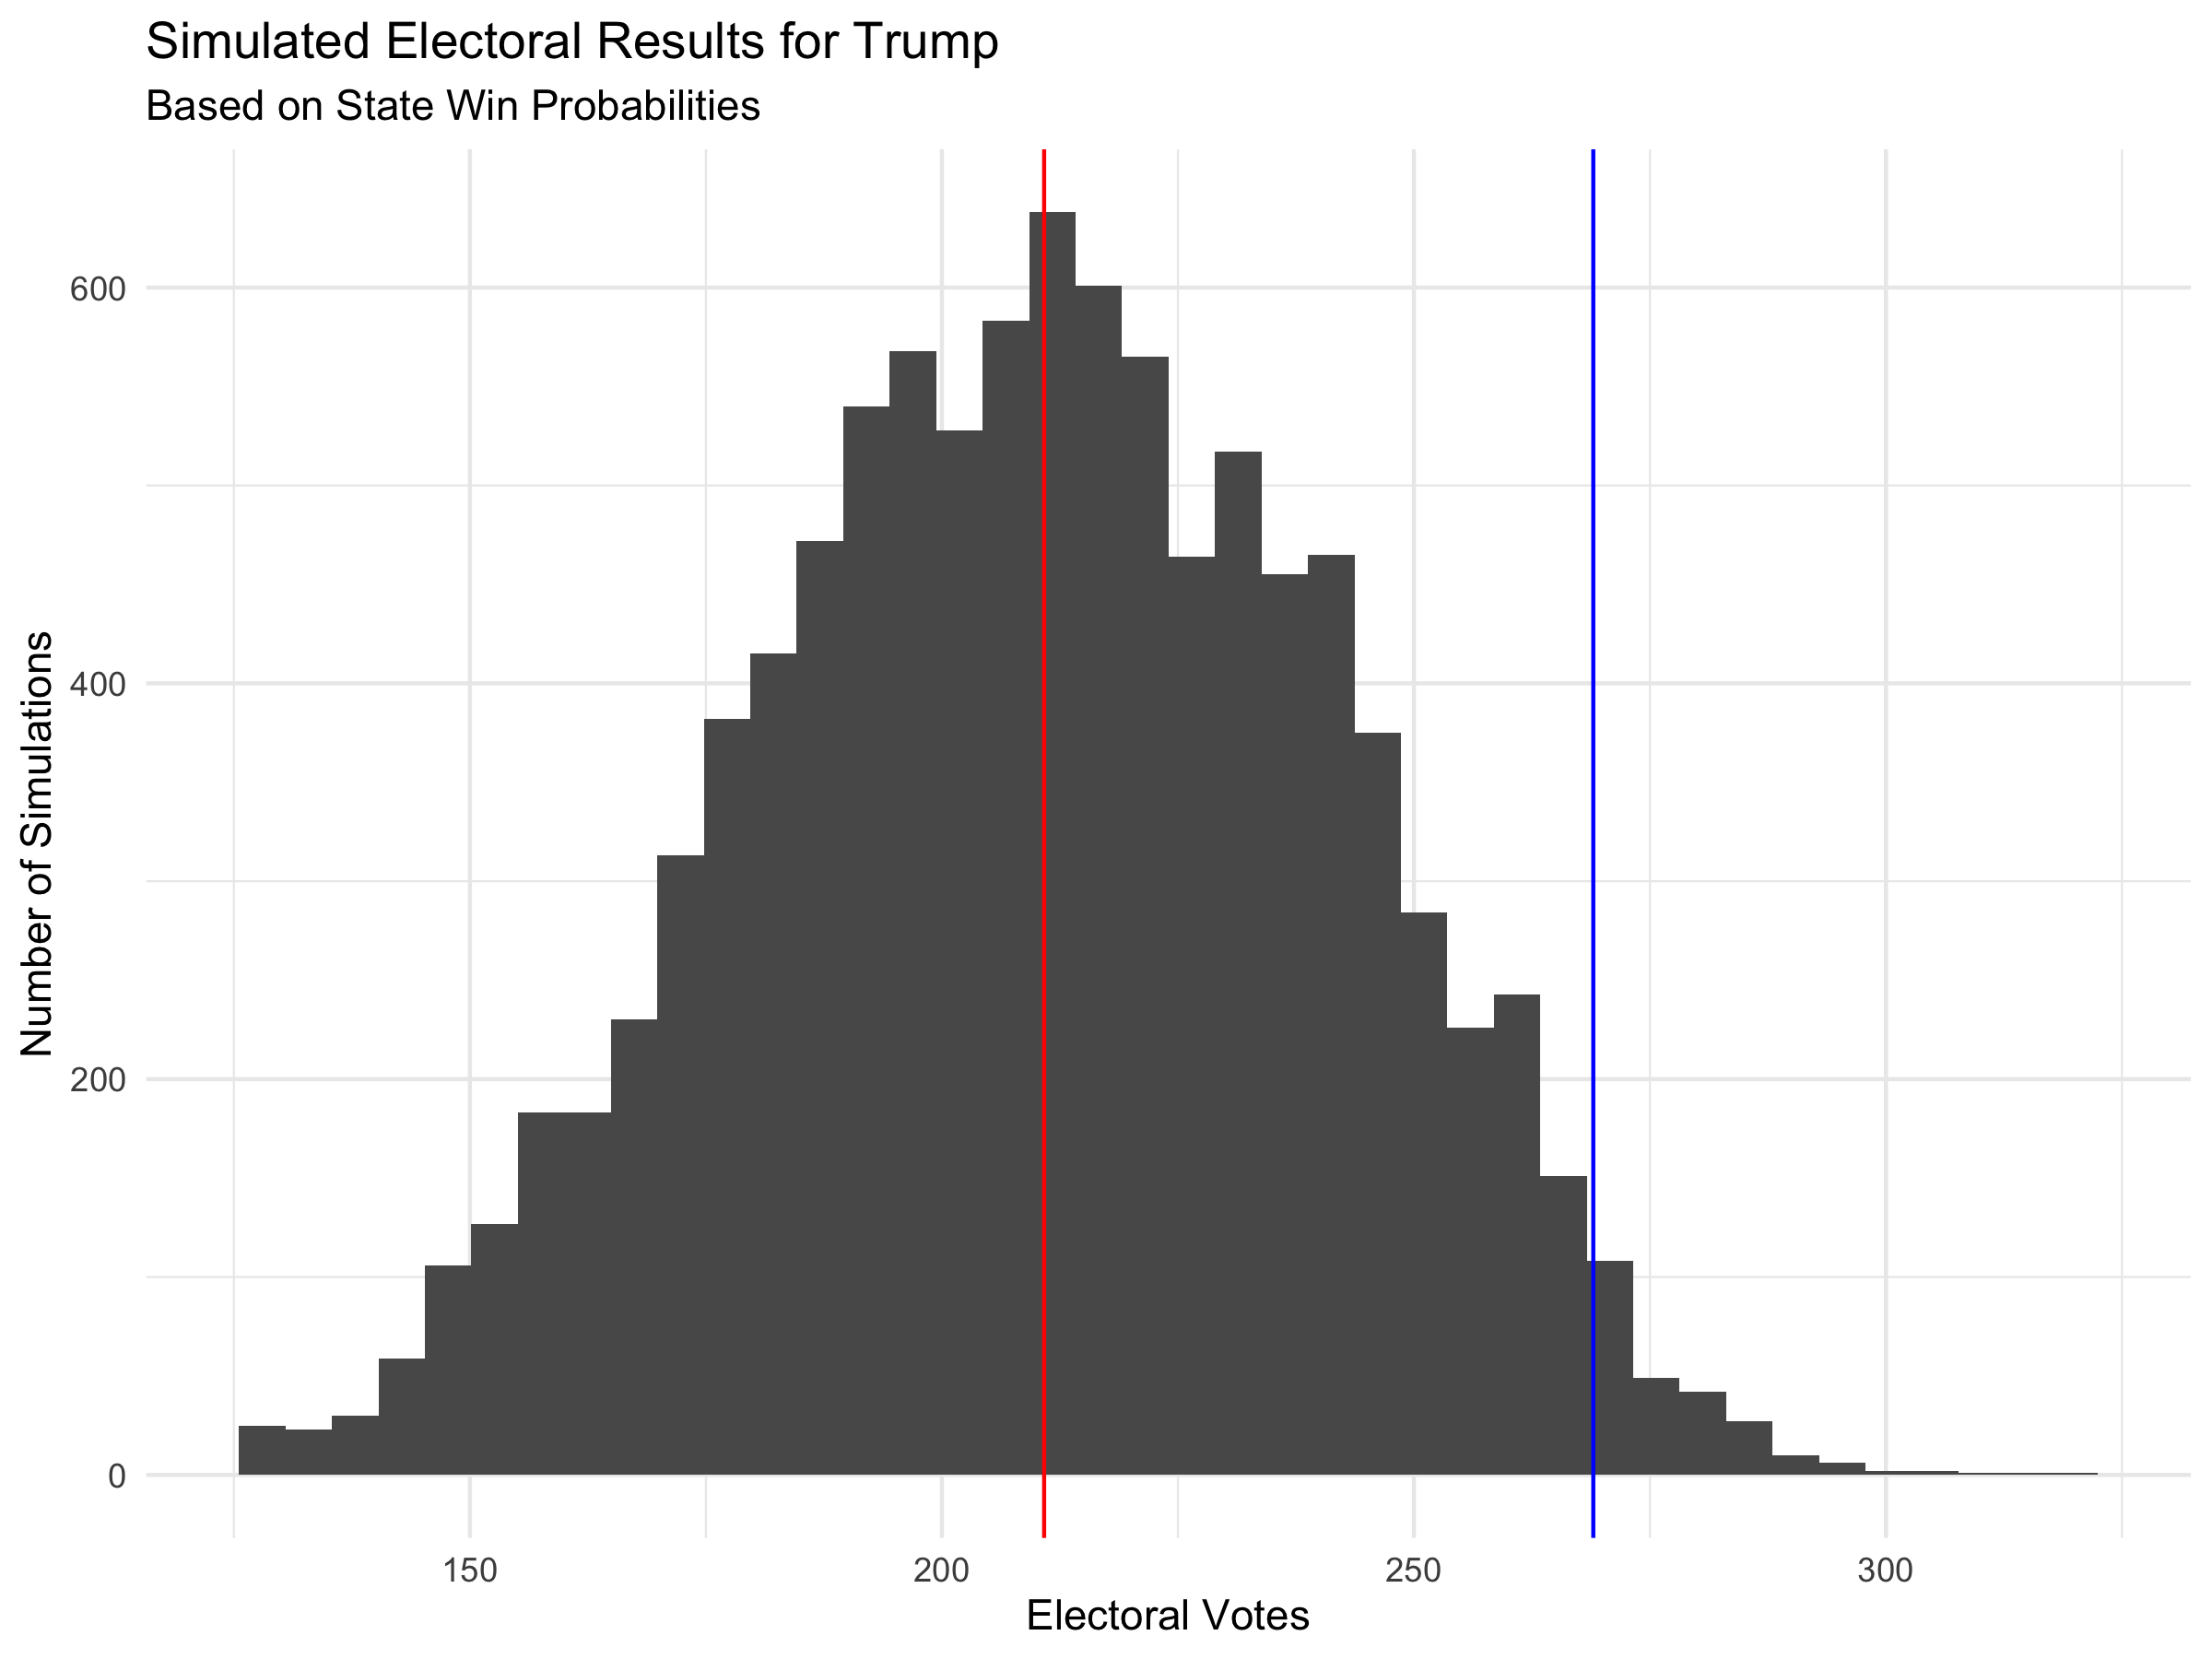
From this plot we can see that Trump does not get a majority of electoral votes in most simulations. In particular, on average Trump receives 211 electoral votes. Furthermore, 95% of all simulations have Trump getting between 152 and 270 electoral votes and Trump won the election in 2.49% of simulations.
This means that Biden is more likely to win the election than Trump, but Trump still has a nonzero chance of winning.
Conclusion
My model uses a regression of historical polling data from the October and November and polling data from 10/30/2020 to predict the 2020 presidential election. The state-by-state result of my model suggests that Biden will win the electoral vote with 350 votes to Trump’s 188. Furthermore, I predict that Biden will win the national two-party popular vote with 53.9% of the vote to Trump’s 46.1%. Ultimately, I found that Trump has a 2.49% chance of winning the election.
(Each of my predictions has associated uncertainties that are explained above.)
In conclusion, while there is a chance that Trump wins, I predict that Biden will win the 2020 US Presidential Election.